BenefitWrinkle area ↓ → Fine lines ↓ → Smoother skin within 20 min
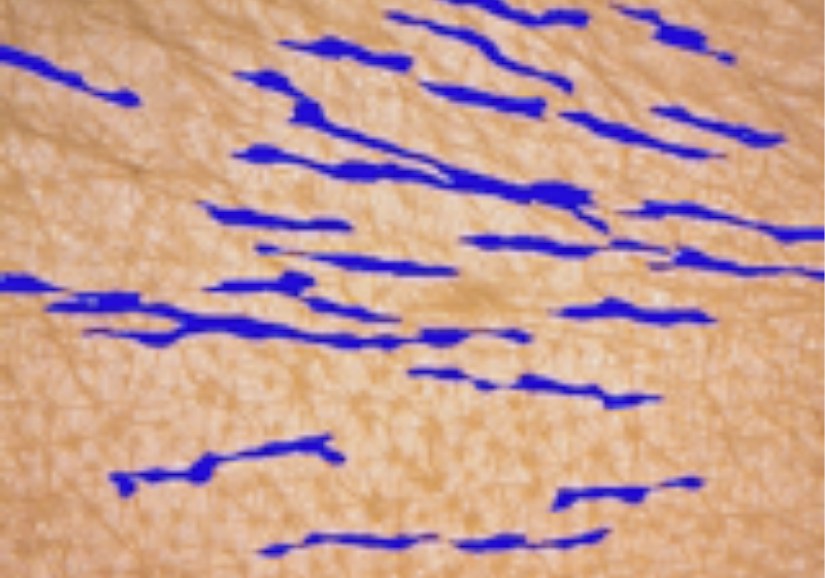
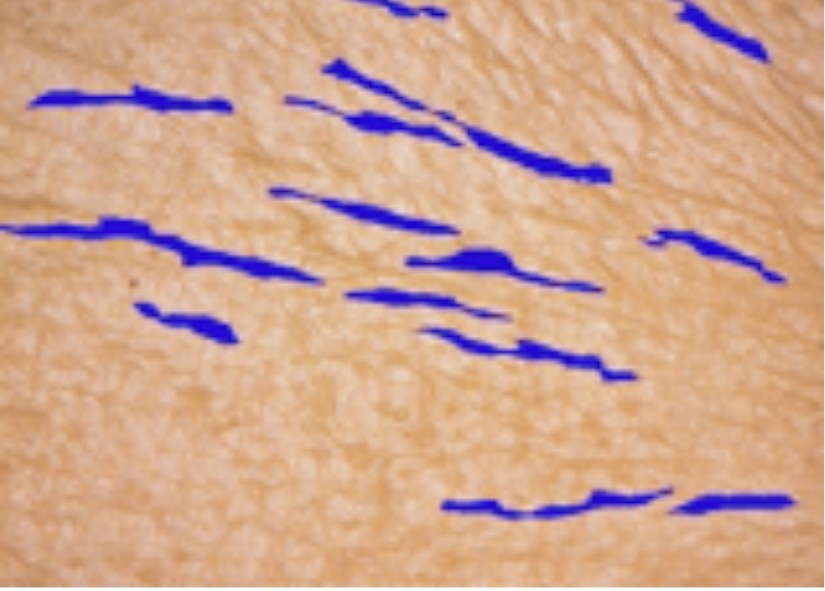
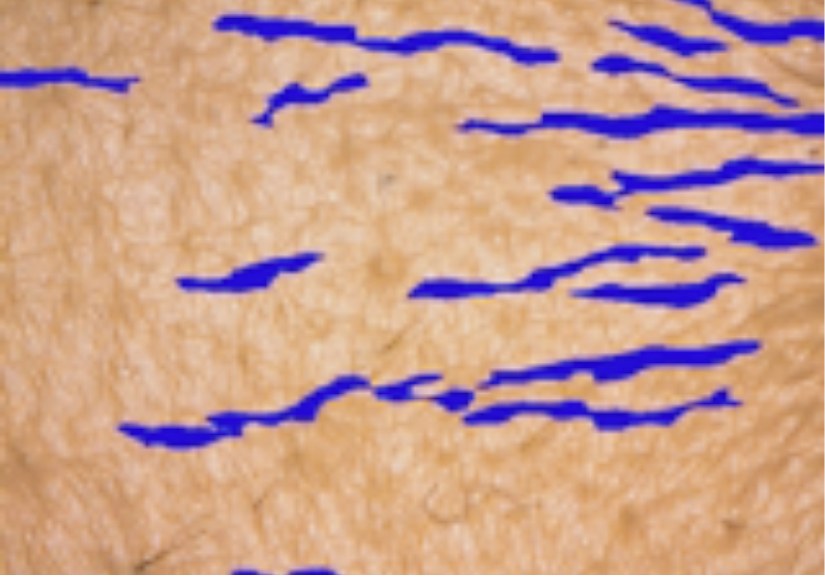
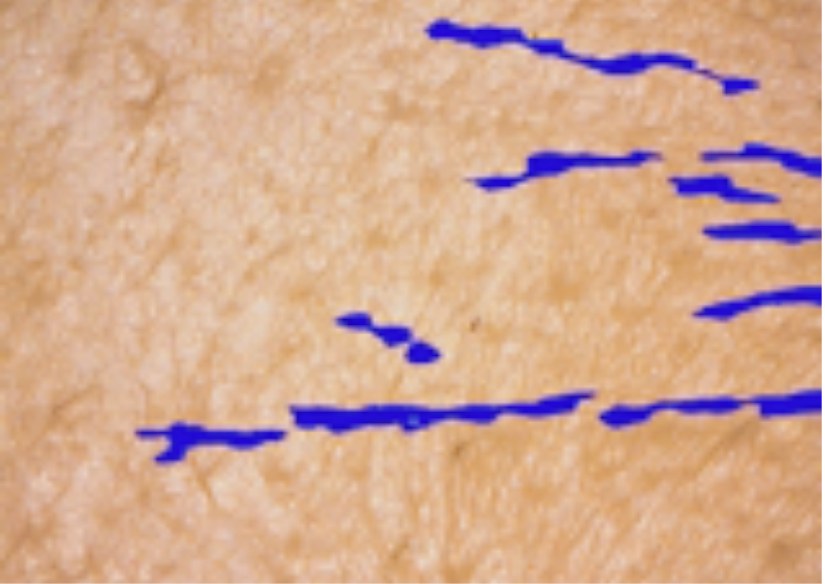
Wrinkle areaA silicone cast of the skin lines is imaged to calculate the wrinkle area. ↓ Lower is better.
↓ 30.6%Wrinkle area | eye corner | 20 min
100.0%Before
69.4% ± 22.4%UMO®
p < 0.05 | before = 100
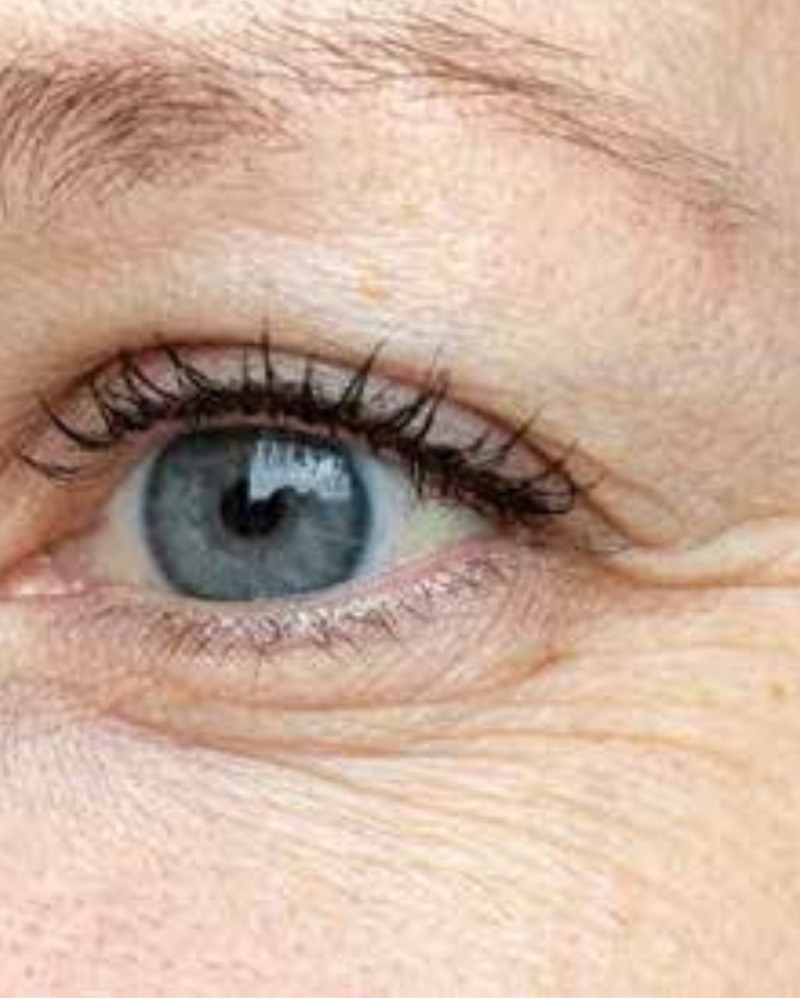
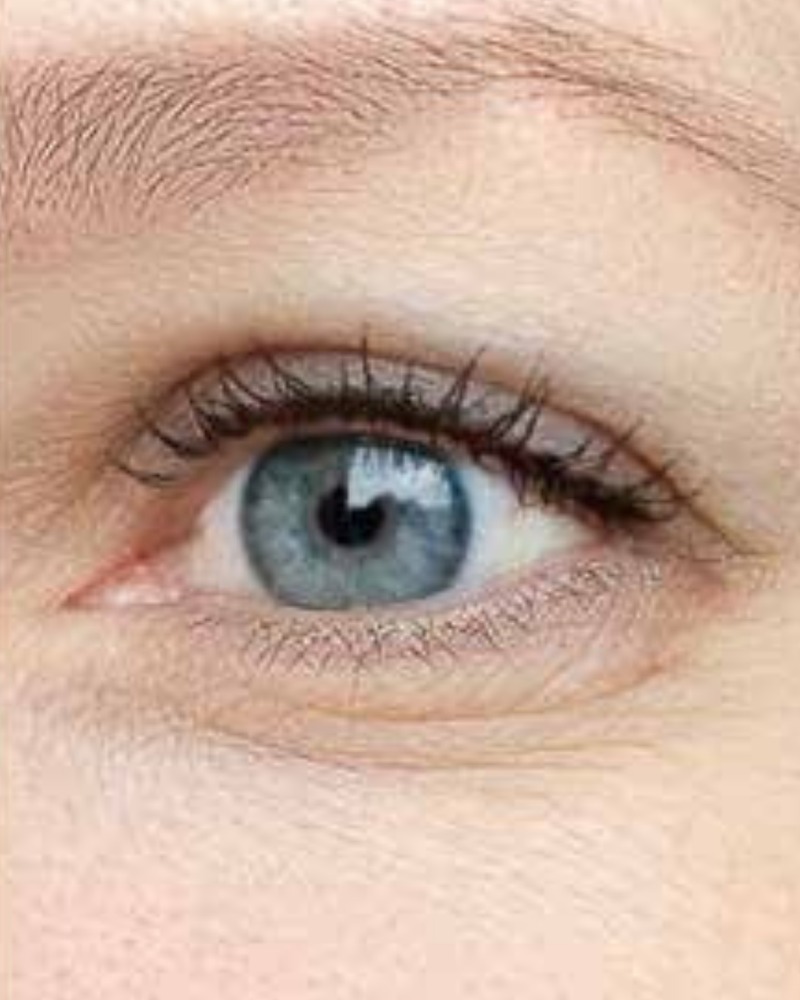
BeforeAfter
Replica | No.2 | No.5Blue = wrinkle area | before = 100
No.2↓ 53.8%100 → 46.2
Before | 100After 20 min | 46.2
No.5↓ 37.4%100 → 62.6
Before | 100After 20 min | 62.6
Note | Only 2 of 5 shown | ↓ 30.6% = mean of 5
APA Corporation. (2022).Evaluation of the Effect of UMO Concentrated Solution on Facial Expression Wrinkles(Test conducted on May 26, 2022).Kirei Test Lab Co., Ltd.
Real-time PCRMeasures how active a gene is. Control = 100; > 100 = more active, < 100 = less active.
MMP1Collagen-breaking enzyme → skin loses firmness. ↓ Lower is better.
↓ 11.0%MMP1 (collagen breakdown), 0.03% vs control
100.0%Control
92.0% †0.01%
89.0% *0.03%
117.0%0.1%
MMP1 ↓ better
* p < 0.05 | mean ± s.d.
HAS2Makes hyaluronic acid → helps skin hold water. ↑ Higher is better.
↑ 33.0%HAS2, 0.1% vs control
100.0%Control
112.0% *0.01%
111.0%0.03%
133.0% **0.1%
HAS2 ↑ better
** p < 0.01 | mean ± s.d.
Gene
Control
0.01%
0.03%
0.1%
MMP1 ↓
100.0% ± 4.0%
92.0% ± 4.0% † (−8.0%)
89.0% ± 4.0% * (−11.0%)
117.0% ± 26.0% (+17.0%)
HAS2 ↑
100.0% ± 3.0%
112.0% ± 6.0% * (+12.0%)
111.0% ± 2.0% (+11.0%)
133.0% ± 6.0% ** (+33.0%)
Mean ± s.d. | † p < 0.1 | * p < 0.05 | ** p < 0.01
APA Corporation. (2019, August 19).Evaluation of the Effect of UMO Concentrated Solution on Anti-Aging Related Gene Expression Using Real-Time PCR(Test No. CGE19081901).Kirei Test Lab Co., Ltd.
Real-time PCRMeasures how active a gene is. Control = 100; > 100 = more active, < 100 = less active.
FLGBreaks down into amino acids → becomes natural moisturizing factor (NMF), helps skin hold water. ↑ Higher is better.
↑ 20.0%FLG, 0.01% vs control
100.0%Control
120.0% **0.01%
102.0%0.03%
94.0%0.1%
FLG ↑
Only 0.01% significant | 0.03% and 0.1% n.s. ** p < 0.01 | mean ± s.d.
GBAMakes ceramide 1 → strengthens the skin barrier. ↑ Higher is better.
↑ 27.0%GBA, 0.1% vs control
100.0%Control
109.0%0.01%
117.0% *0.03%
127.0% *0.1%
GBA ↑
* p < 0.05 | mean ± s.d.
TGM1Helps form the cornified envelope (CE) → strengthens the skin barrier. ↑ Higher is better.
↑ 16.0%TGM1, 0.1% vs control
100.0%Control
98.0%0.01%
96.0%0.03%
116.0% †0.1%
TGM1 ↑
† p < 0.1 | mean ± s.d.
HAS3Makes hyaluronic acid in the epidermis → helps skin hold water. ↑ Higher is better.
↑ 36.0%HAS3, 0.1% vs control
100.0%Control
109.0%0.01%
106.0%0.03%
136.0% †0.1%
HAS3 ↑
† p < 0.1 | mean ± s.d.
Gene
Control
0.01%
0.03%
0.1%
FLG ↑
100.0% ± 4.0%
120.0% ± 5.0% ** (+20.0%)
102.0% ± 12.0% (+2.0%)
94.0% ± 13.0% (−6.0%)
TGM1 ↑
100.0% ± 10.0%
98.0% ± 6.0% (−2.0%)
96.0% ± 5.0% (−4.0%)
116.0% ± 6.0% † (+16.0%)
HAS3 ↑
100.0% ± 10.0%
109.0% ± 8.0% (+9.0%)
106.0% ± 8.0% (+6.0%)
136.0% ± 22.0% † (+36.0%)
GBA ↑
100.0% ± 6.0%
109.0% ± 13.0% (+9.0%)
117.0% ± 4.0% * (+17.0%)
127.0% ± 11.0% * (+27.0%)
Mean ± s.d. | † p < 0.1 | * p < 0.05 | ** p < 0.01
APA Corporation. (2019, August 19).Evaluation of the Effect of UMO Concentrated Solution on Moisturizing and Barrier Function Related Gene Expression Using Real-Time PCR(Test No. CGE19081902).Kirei Test Lab Co., Ltd.
BenefitElastin breakdown ↓ → Elasticity ↑ + Fine lines ↓
Terms
Inhibition rateHow much less the enzyme worked with UMO®. ↑ Higher is better.
Elastase activityAn enzyme that breaks down elastin, so skin loses elasticity. ↓ Lower is better.
↓ 22.6%Elastase activity, serum 3% vs control
100.0%Control
105.4%Serum 0.3%
77.4% **Serum 3%
** p < 0.01 | mean ± s.d.
Item
Control (water)
Serum 0.3%
Serum 3%
Activity ↓
100.0% ± 3.3%
105.4% ± 4.2% (+5.4%)
77.4% ± 3.9% ** (−22.6%)
Inhibition ↑
0.0% ± 3.3%
−5.4% ± 4.2%
22.6% ± 3.9%
Mean ± s.d. | ** p < 0.01 | negative = above control
APA Corporation. (2022).Evaluation of Elastase Inhibitory Activity of a Serum Containing UMO Concentrated Solution(Test No. CBS19021801).Kirei Test Lab Co., Ltd.
Water loss (TEWL)Transepidermal water loss: the water that evaporates from the skin surface. ↓ Lower is better.
↓ 19.3%TEWL, 1 h vs control
98.6%Control
79.6%UMO®
1 h
* p < 0.05 | before = 100
Group
Before
30 min
1 h
2 h
Control ↓
100.0% ± 0.0%
102.4% ± 18.6%
98.6% ± 11.3%
96.8% ± 17.7%
UMO® ↓
100.0% ± 0.0%
78.2% ± 23.5% (−23.6%)
79.6% ± 27.1% * (−19.3%)
84.0% ± 18.9% (−13.2%)
Mean ± s.d. | paired t-test | * p < 0.05
APA Corporation. (2022).Evaluation of the Immediate Effect of UMO Concentrated Solution on Skin Barrier Function(Test No. CSA190207).Kirei Test Lab Co., Ltd.
BenefitHyaluronic acid ↑ → Moisture ↑ → Fine lines ↓
Hyaluronic acidA naturally occurring sugar molecule (humectant) in the body that attracts and binds up to 1,000 times its weight in water.
↑ 24.3%Hyaluronic acid, 0.01% vs control
100.0%Control
124.3% **0.01%
113.6%0.1%
107.0%1%
** p < 0.01 | mean ± s.d.
Item
Control
0.01%
0.1%
1%
HA production ↑
100.0% ± 0.7%
124.3% ± 5.5% ** (+24.3%)
113.6% ± 9.8% (+13.6%)
107.0% ± 7.8% (+7.0%)
OD405 (mOD) ↑
229.0 ± 2.0
285.0 ± 13.0
260.0 ± 23.0
245.0 ± 18.0
Mean ± s.d. | ** p < 0.01 | final medium conc.
APA Corporation. (2019, February 5).Evaluation of the Effect of UMO Concentrated Solution on Hyaluronic Acid Production in Human Dermal Fibroblasts(Test No. CAS19020503).Kirei Test Lab Co., Ltd.
BenefitTyrosinase ↓ → Melanin ↓ → Dark spots ↓ + Even tone ↑
Terms
Inhibition rateHow much less active the enzyme is than the control. ↑ Higher is better.
In vitroTested in a tube or dish, not on people; a first screening result.
TyrosinaseThe key enzyme that makes melanin. Lower activity means less melanin.
↓ 65.7%Tyrosinase, 10% powder vs control
100.0%Control
93.8%0.001%
34.3% ***10%
*** p < 0.001
Conc. (%)
Activity (%)
Inhibition (%)
p
Control
100.0 ± 5.4
0.0 ± 5.4
–
0.001
93.8 ± 1.3
6.2 ± 1.3
–
10
34.3 ± 7.3
65.7 ± 7.3
< 0.001
Mean ± s.d. | n = 3 | no p for 0.001%
APA Corporation. (2020, March 16).Evaluation of Tyrosinase and Elastase Inhibitory Activity of UMO Micron Powder (Beauty 3-Domain Review Set: Whitening, Anti-Aging, Antioxidant) (Test No. CBS200316).Kirei Test Lab Co., Ltd.
BenefitElastin breakdown ↓ → Elasticity ↑ + Fine lines ↓
Terms
Inhibition rateHow much less the enzyme worked with UMO®. ↑ Higher is better.
In vitroTested in a tube or dish, not on people; a first screening result.
ElastaseAn enzyme that breaks down elastin, so skin loses elasticity. ↓ Lower is better.
↓ 61.3%Elastase, 1% powder vs control
100.0%Control
85.8% ***0.001%
38.7% ***1%
27.9% ***10%
*** p < 0.001 | mean ± s.d.
Conc. (%)
Activity (%)
Inhibition (%)
p
Control
100 ± 2.1
0 ± 2.1
–
0.001
85.8 ± 0.5
14.2 ± 0.5
< 0.001
1
38.7 ± 0.3
61.3 ± 0.3
< 0.001
10
27.9 ± 0.3
72.1 ± 0.3
< 0.001
From deck table | mean ± s.d., n = 3
APA Corporation. (2020, March 16).Evaluation of Tyrosinase and Elastase Inhibitory Activity of UMO Micron Powder (Beauty 3-Domain Review Set: Whitening, Anti-Aging, Antioxidant) (Test No. CBS200316).Kirei Test Lab Co., Ltd.
Free radicalsUnstable molecules from metabolism and UV that damage cells and speed up ageing.
ESRDetects free-radical signals directly. Scavenging rate ↑ higher is better.
Superoxide O₂⁻The most common one; turns into stronger radicals.
↑ 85.0%Scavenging, UMO® 10×
85.0%10×
65.5%100×
12.5%1000×
Superoxide O₂⁻ ↑
↑ better
Hydroxyl ·OHThe strongest oxidant; damages cells, proteins and DNA.
↑ 67.2%Scavenging, UMO® 10×
67.2%10×
13.8%100×
−3.9%1000×
Hydroxyl ·OH ↑
↑ better
Singlet oxygen ¹O₂Formed when skin meets UV; causes photoageing.
↑ 17.2%Scavenging, UMO® 10×
17.2%10×
1.9%100×
Singlet oxygen ¹O₂ ↑
↑ better
ROS
Share in body
10×
100×
1000×
Superoxide (O₂⁻)
≈ 70–80%
85.0%
65.5%
12.5%
Hydroxyl (·OH)
≈ 5–10%
67.2%
13.8%
−3.9% (no effect)
Singlet oxygen (¹O₂)
≈ 1–3%
17.2%
1.9% (weak)
–
↑ better | – = not in deck
Taiichi Maeda, Chang-Il Lee, & Fumihiko Yoshino. (January 2014).Measurement of the Scavenging Ability of Water-Soluble Silicon "UMO®" Against Various Reactive Oxygen Species Using the Electron Spin Resonance (ESR) Method.Kanagawa Dental University Graduate School.
C. acnesSkin bacteria that cause acne when they overgrow.
LegionellaLives in water systems; can cause pneumonia.
E. coliA hygiene indicator.
C. albicansA yeast that can cause skin rashes.
Viable countLiving bacteria per mL. ↓ Lower is stronger; <10 = not detected.
Antibacterial↓ > 99.9%
C. acnes → not detected | 5 minCount /mL | vs control
Note | Candida ↓ 15.7% = normal error, not bactericidal
Microbe
Group
Start
5 min
15 min
60 min
E. coli
UMO®
—
3.2×10⁵
1.6×10⁵
2.5×10³ (↓ 99.5%)
Control
5.6×10⁵
—
—
5.4×10⁵
Legionella
UMO®
—
< 100
< 100
< 100 (↓ > 99.9%)
Control
3.0×10⁶
—
—
3.2×10⁶
C. albicans
UMO®
—
4.5×10⁵
4.5×10⁵
4.3×10⁵ (↓ 15.7%)
Control
4.9×10⁵
—
—
5.1×10⁵
Count /mL | < 100 = not detected | ( ) vs control, 60 min
Microbe
Group
Start
5 min
15 min
30 min
C. acnes
UMO®
—
< 10 (↓ > 99.9%)
< 10 (↓ > 99.9%)
< 10 (↓ > 99.9%)
Control
4.4×10⁵
4.1×10⁵
5.3×10⁵
5.6×10⁵
Count /mL | < 10 = not detected | ( ) vs control
Japan Food Research Laboratories. (2016, October 28).Bactericidal Effect Test of UMO Concentrated Solution (1% Dilution) (Test No. 16105672001-0101).Japan Food Research Laboratories. (2017, February 27).Bactericidal Effect Test of UMO Concentrated Solution (Acidic) (Test No. 17005338001-0101).
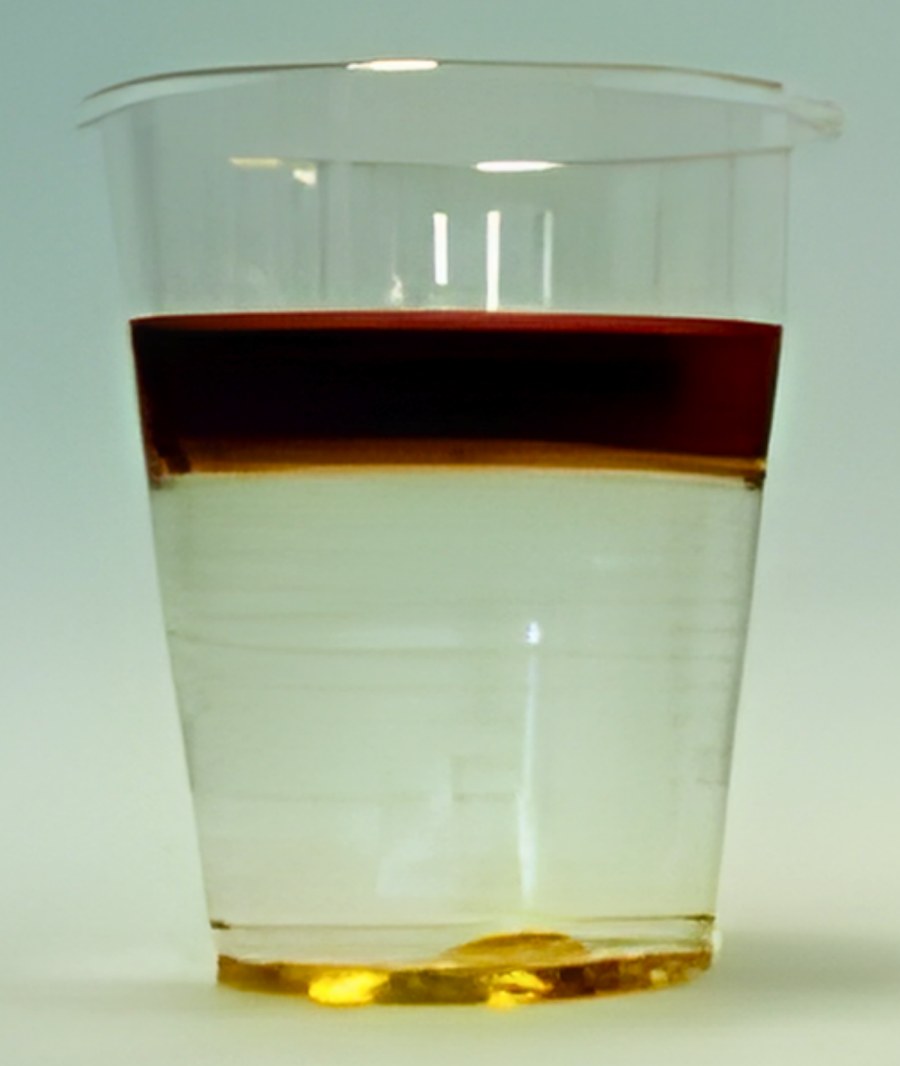
EmulsificationMixing oil and water, which normally repel each other.
EmulsificationOil + water
Sesame oil + water mix with UMO®Demo | not a medical claim
Oil & water: separated+ UMO®: mixed
Demo | sesame oil & water | ± UMO® liquid
Note | Demo only | not a medical claim
Physical Property: Protective Coating & Oxidation
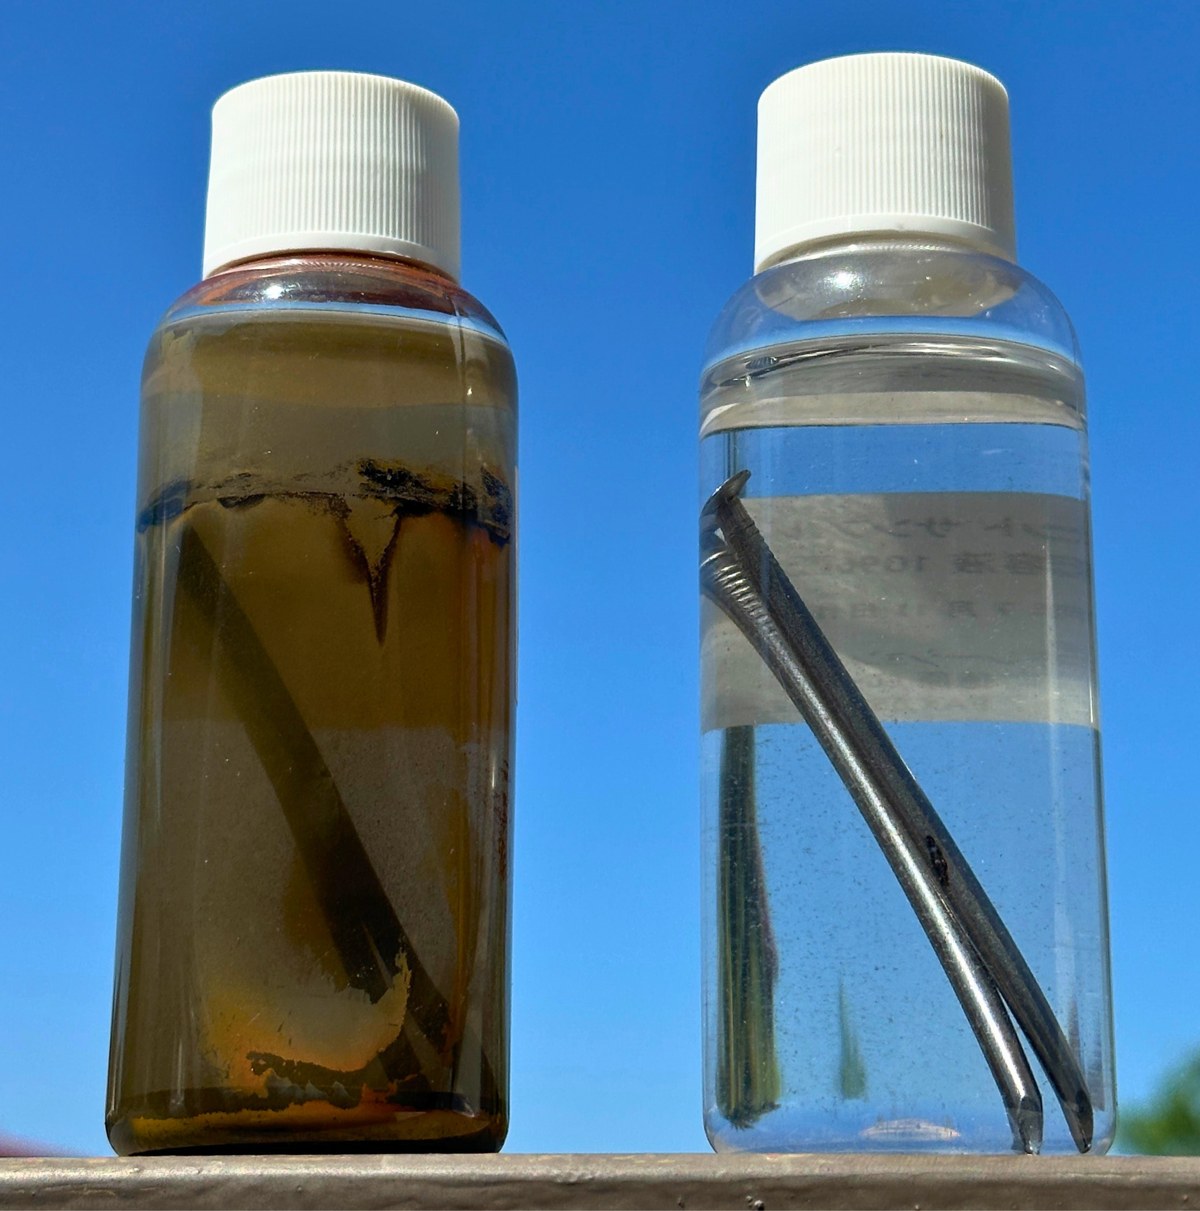
Demo
TestIron nail | water vs water + 5% UMO®
Duration2014 → 2026
BenefitSilicon film on iron → Oxygen & water blocked → Rust‑free for 12 years
Terms
Protective coatingA thin silicon film on the iron surface that blocks oxygen and water.
Rust protection12 years
Iron nail in 5% UMO® water: no rustDemo | not a medical claim
Water: rust | 5% UMO®: no rust
Demo | same iron nails | water vs water + 5% UMO® | 2014 → 2026
Note | Demo only | not a medical claim
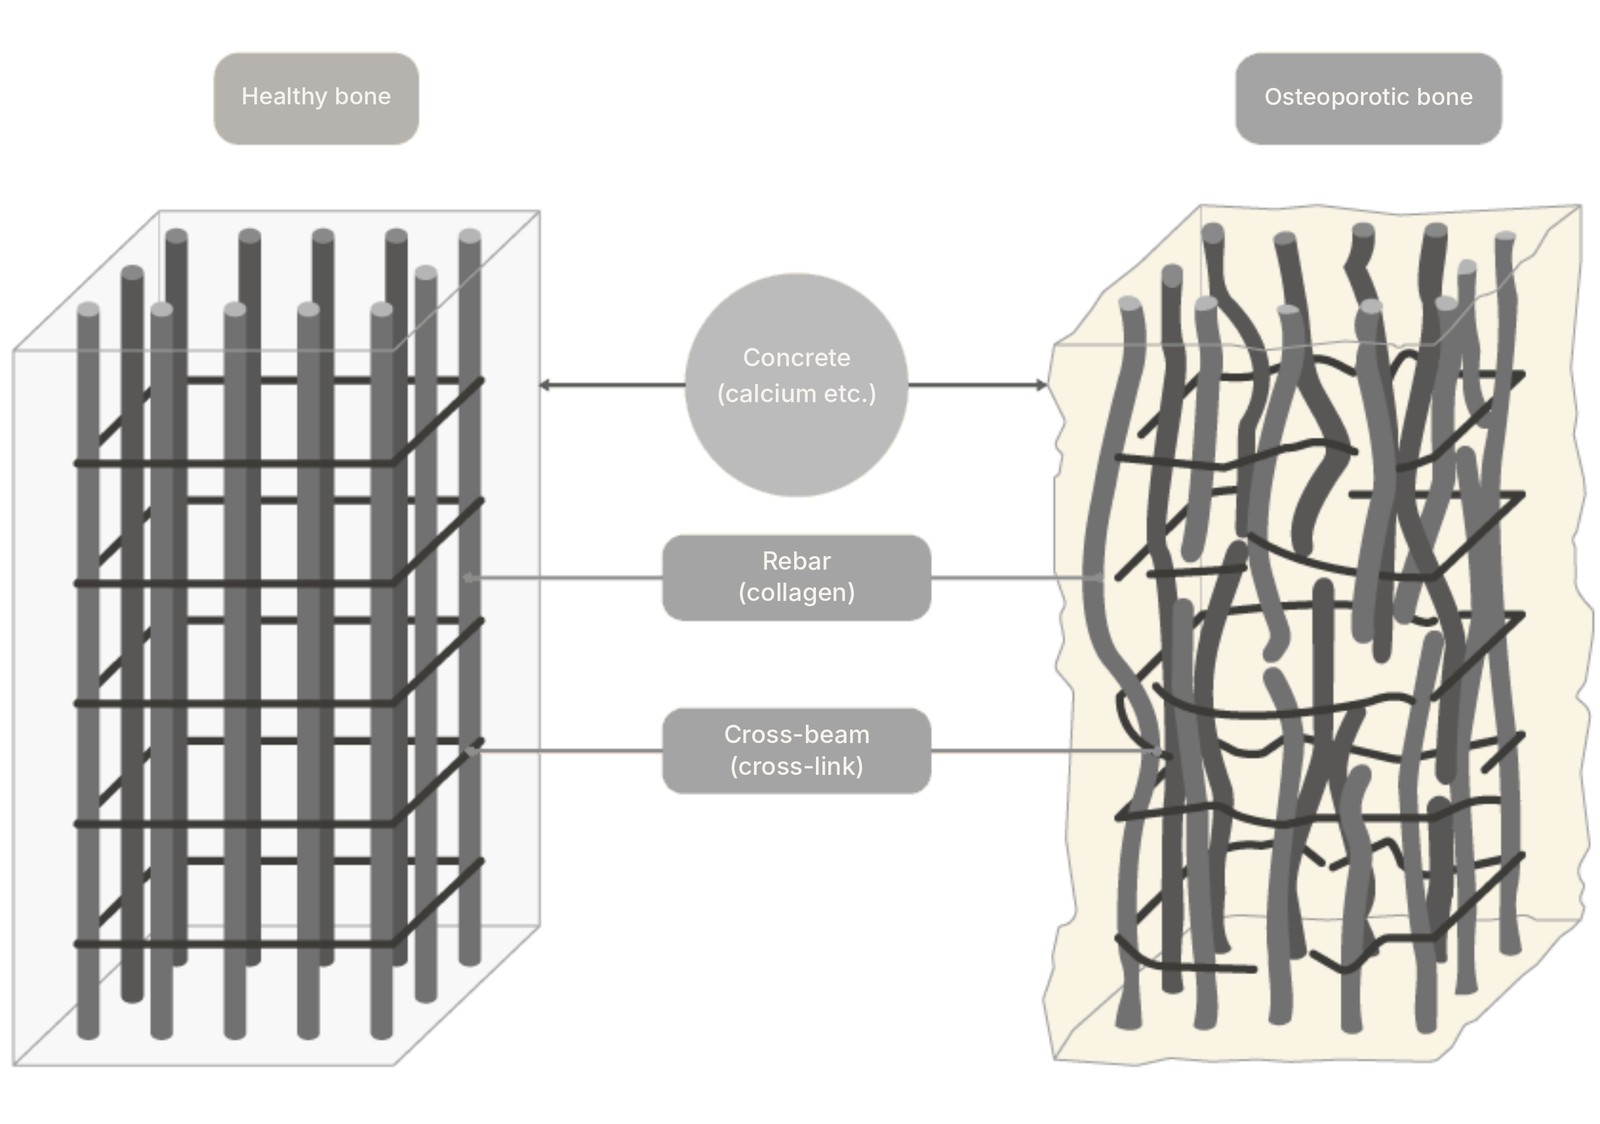
Silicon: The Key to Making Your Own Collagen
Reference | not a UMO test
TypesCollagen types in the body (I–XXVIII)
BenefitFibroblasts ↑ → Procollagen ↑ → Collagen ↑ in skin, vessels & bone
Terms
FibroblastsCells that make collagen.
ProcollagenThe precursor the body turns into collagen.
Collagen28 types
Collagen types in the body (I–XXVIII)
Type
Location
Role
Share
Type I
Skin, bone, tendon, teeth
Most abundant → strength & structure
≈ 90%
Type II
Cartilage, discs
Joint mobility & elasticity
≈ 1%–2%
Type III
Skin, vessels, organs
With Type I → elasticity & softness
≈ 8%
Type IV
Basement membrane
Cell attachment & filtration
< 1%
Type V
Placenta, hair, skin
Sets Type I fibre diameter
< 1%
Type VI
Muscle, connective tissue, skin
Fine ECM network
< 1%
Read from deck image
Reffitt DM, Ogston N, Jugdaohsingh R, Cheung HF, Evans BA, Thompson RP, Powell JJ, Hampson GN. Orthosilicic acid stimulates collagen type 1 synthesis and osteoblastic differentiation in human osteoblast-like cells in vitro. Bone. 2003 Feb;32(2):127-35.Geesin JC, Darr D, Kaufman R, Murad S, Pinnell SR. Ascorbic acid specifically increases type I and type III procollagen messenger RNA levels in human skin fibroblasts. Journal of Investigative Dermatology. 1988 Apr;90(4):420–424. DOI: 10.1111/1523-1747.ep12460849
Reffitt et al., 2003 – Orthosilicic acid stimulates collagen type I synthesis and osteoblastic differentiation in vitro. Bone. Silicon directly boosts collagen and bone-forming cells.Carlisle, 1986 – Silicon as an essential trace element in animal nutrition. Ciba Foundation Symposium. Pioneering research showing silicon as the "biological glue" for collagen-mineral binding.
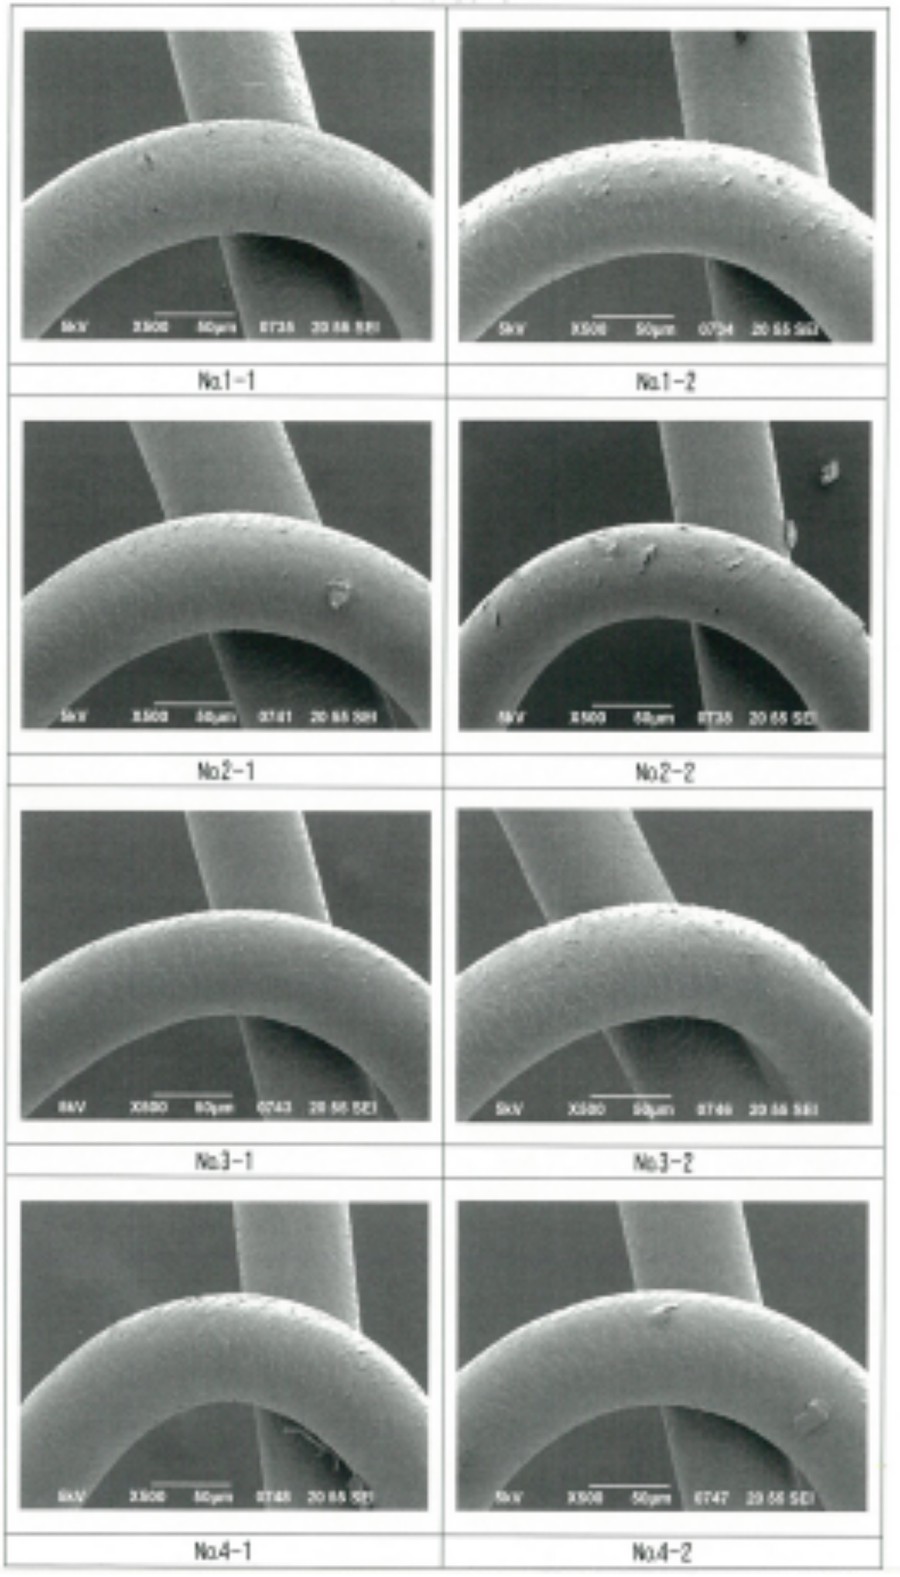
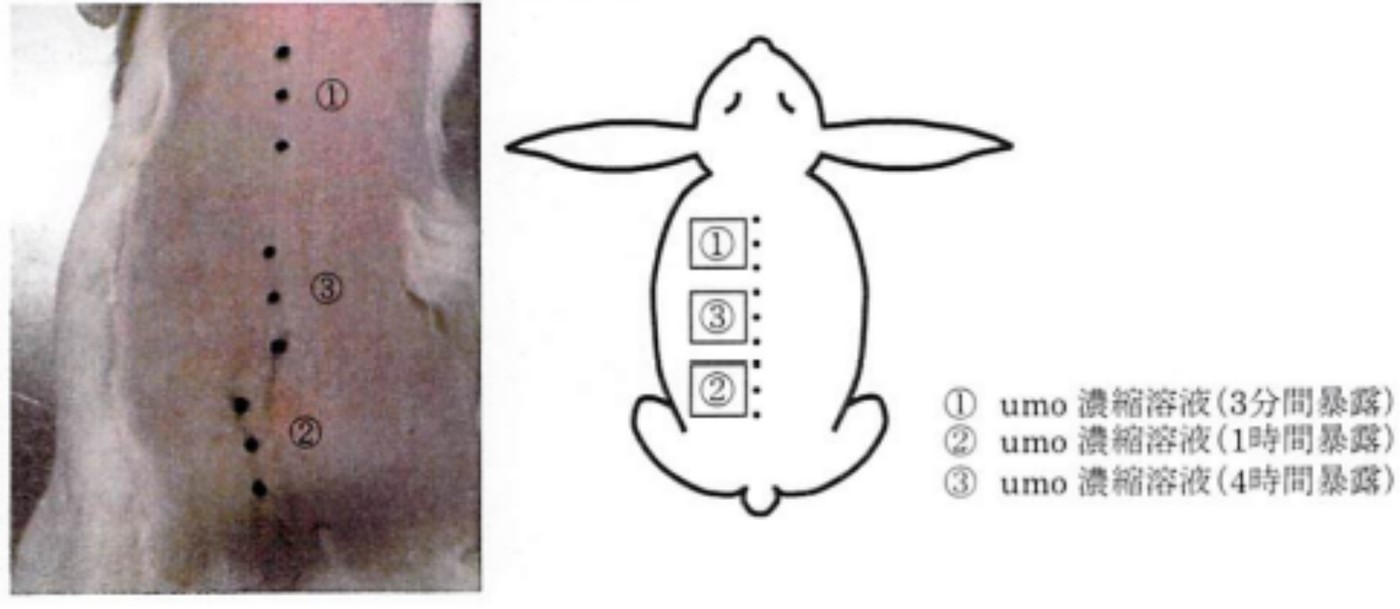
·The safety study under Good Laboratory Practice (GLP) found no genotoxic risk, in both the screening test and the main study.
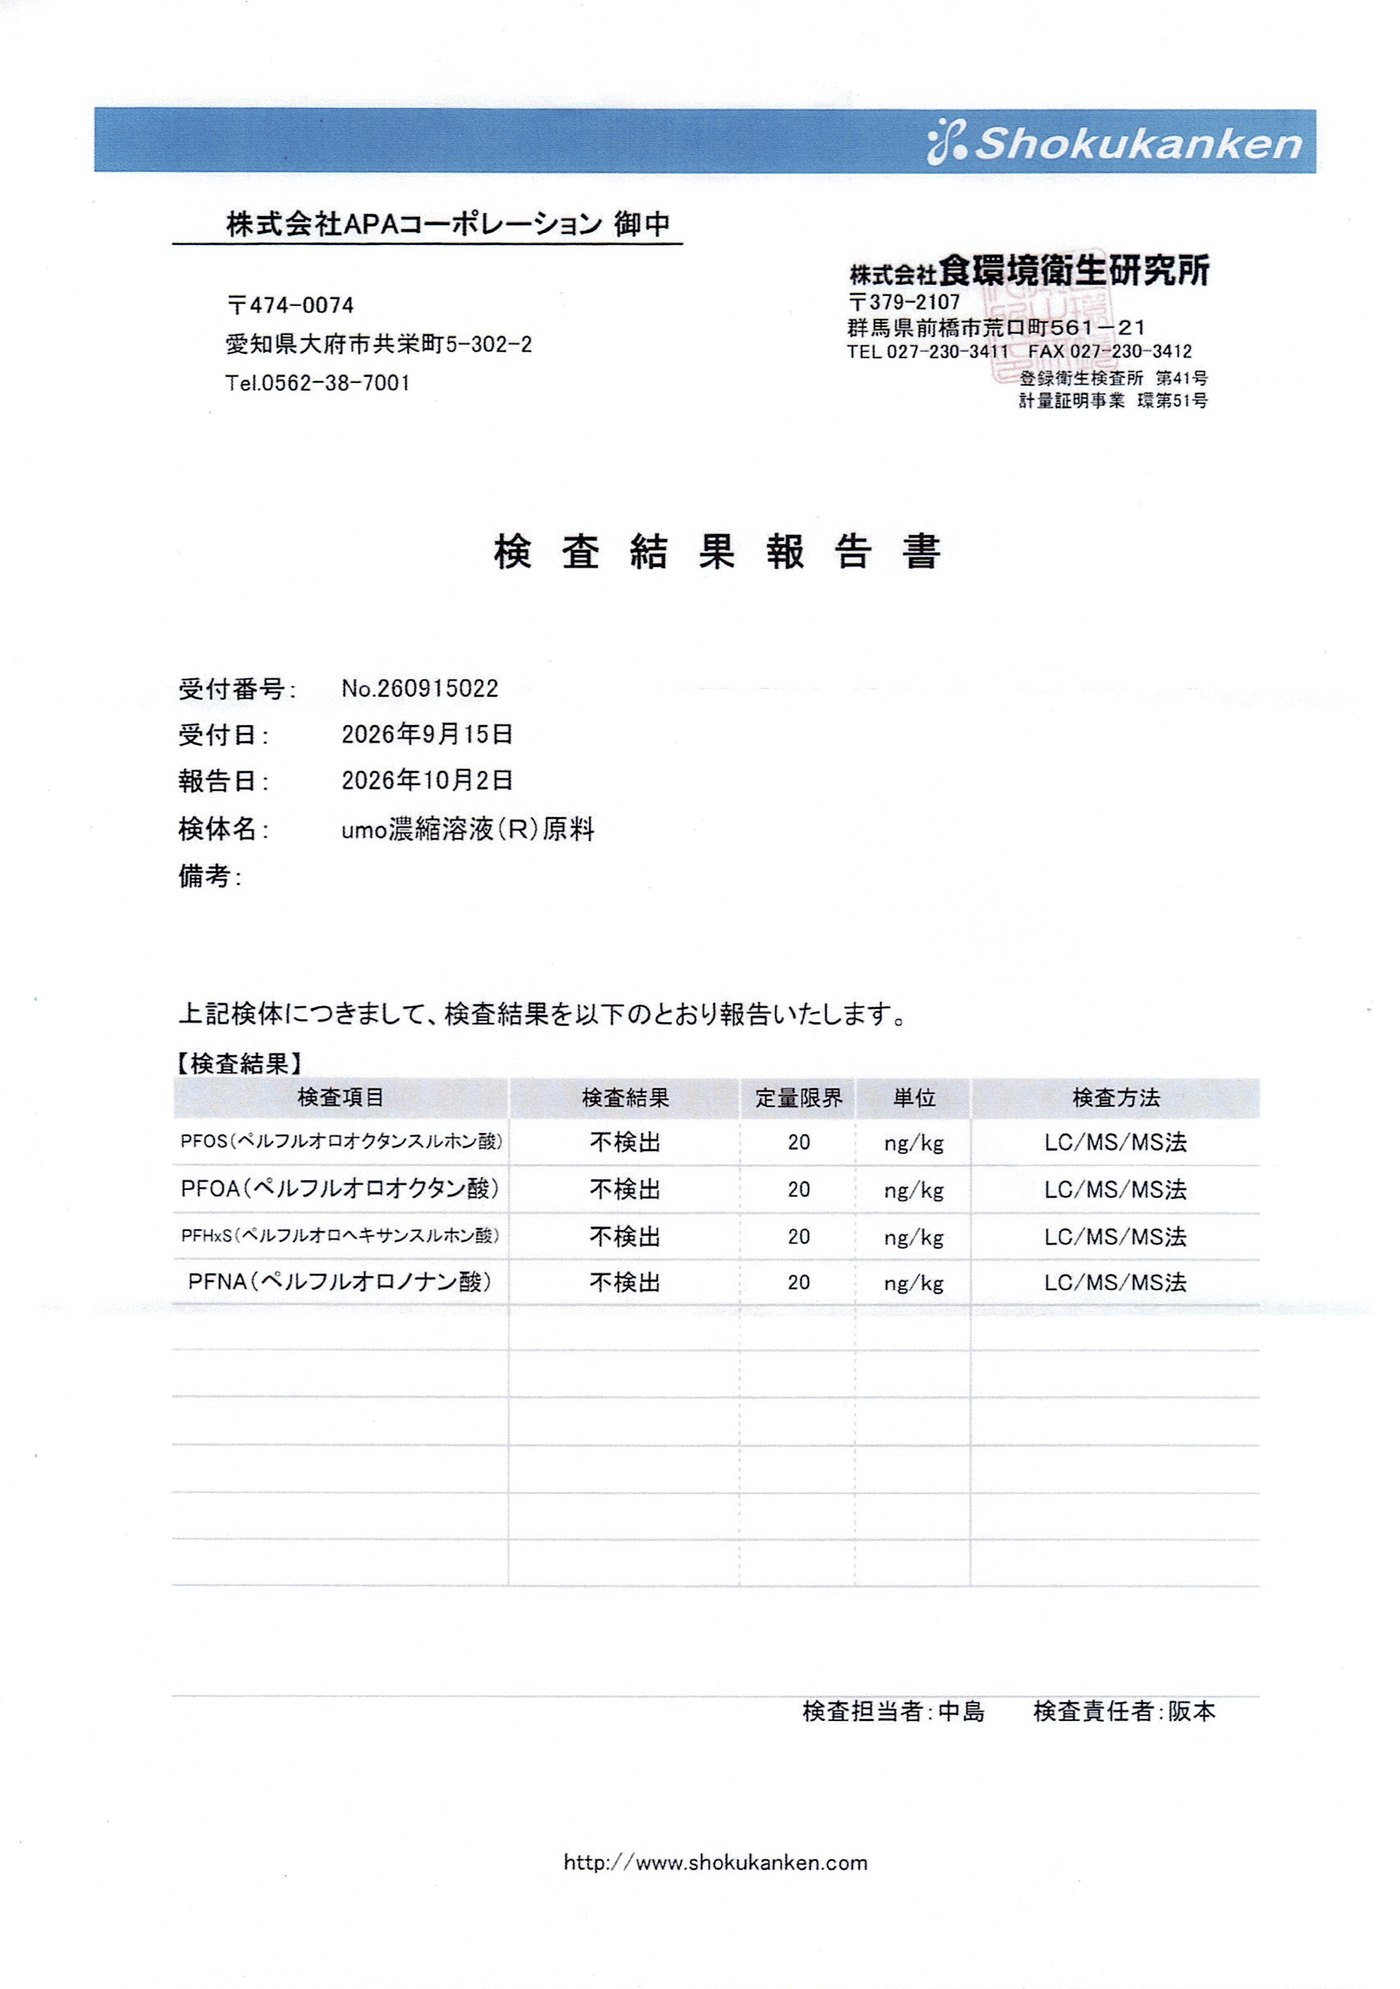
·Four PFAS compounds (PFOS, PFOA, PFHxS, PFNA) were not detected in the UMO concentrated solution raw material. Limit of quantification: 20 ng/kg.
Test reports
XRD testNon-crystalline silicon
GLP studyNo genotoxic risk
2 Oct 2026PFAS test (Shokukanken)
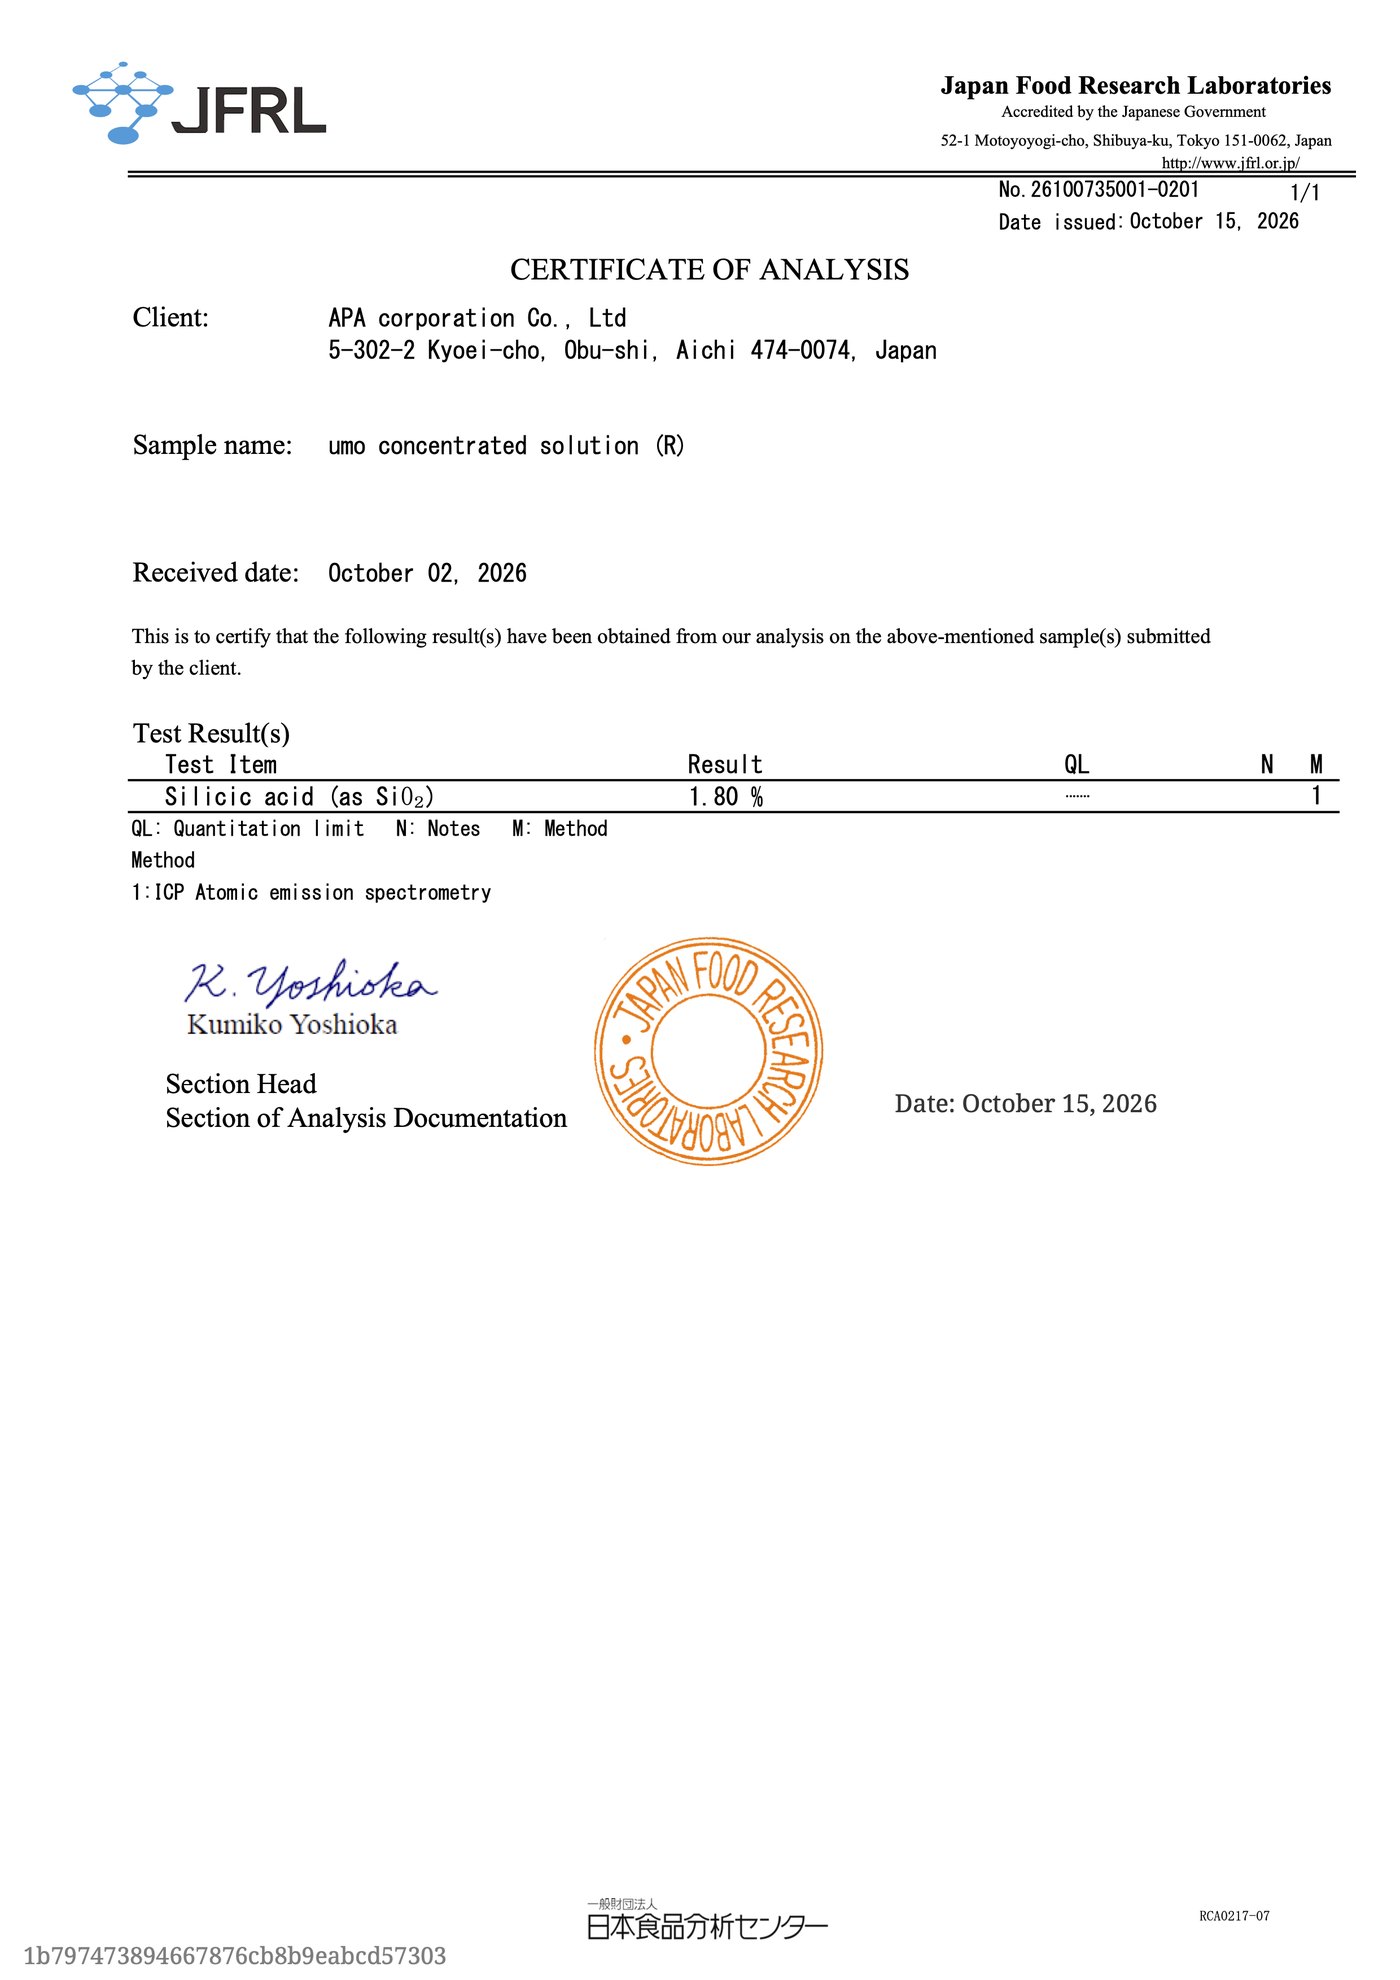
15 Oct 2026Silicic acid 1.80% (JFRL)
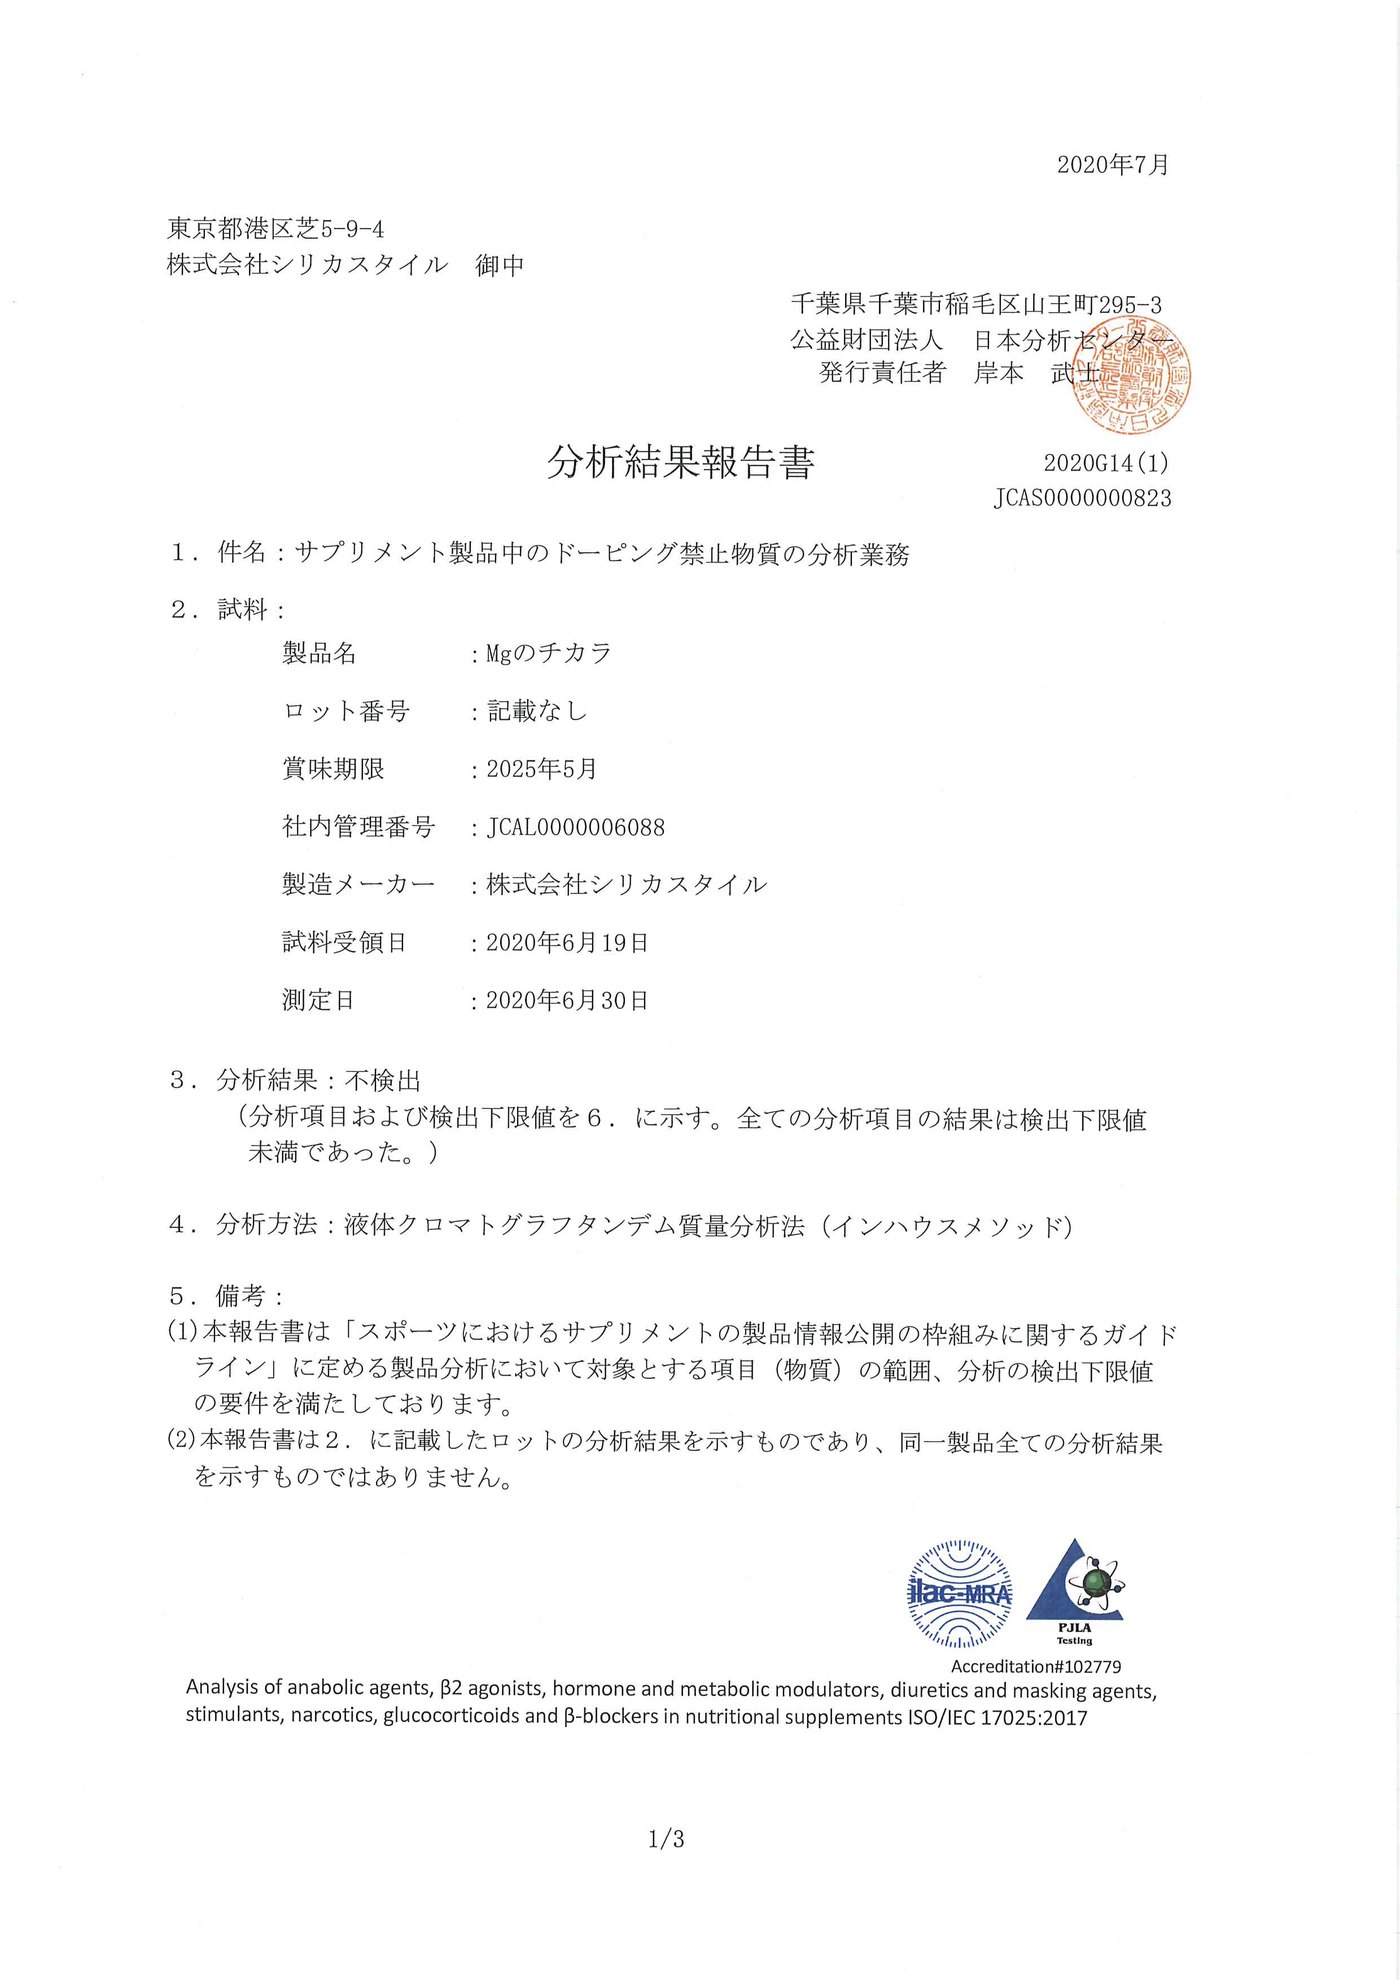
Anti-dopingNo active substance
Certificates
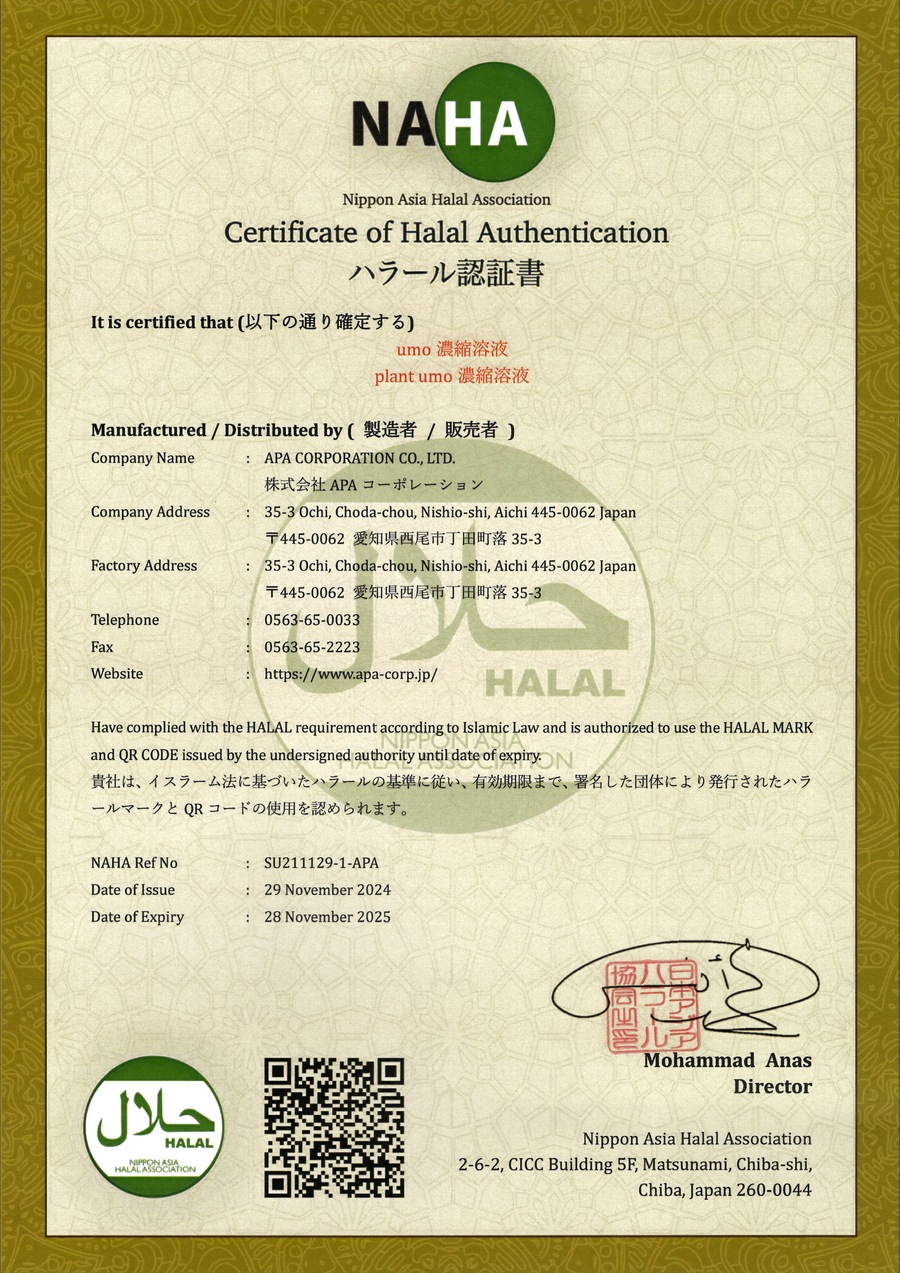
Halal (NAHA)
Valid to 2 Jul 2029JHNFA GMP, dietary supplements
Valid to 24 Aug 2029MAFF GHP and HACCP
19 Sep 2022INCI name registration (PCPC)
·Halal certified by the Nippon Asia Halal Association. Indonesia’s BPJPH recognises NAHA certificates, with the same legal effect for cross-border clearance and sales.
·Made at APA Corporation’s Aichi factory, certified under JHNFA GMP and by Japan’s Ministry of Agriculture, Forestry and Fisheries (MAFF) for hygiene and HACCP.
·The INCI letter registers the name Hydrated Silica. It is not a safety approval.
Bring UMO® to Your Product
Tell us what you make. We reply with the right documents and samples.
This page presents research on the ingredient only.It does not make any claim about a finished product.Results come from the stated test conditions and may not apply to other products or individuals.KIWITA SDN. BHD. is not responsible for how the ingredient is used in any finished product or for any claims made about it.Terms & DisclaimerThe summaries on this page are prepared by KIWITA SDN. BHD. from third-party test reports and published studies. They are for reference only and are not medical, regulatory or professional advice.KIWITA has made reasonable efforts to summarise them accurately. KIWITA does not guarantee that the summaries, figures or translations are complete, current or free from error. If there is any difference, the original report prevails.Test results apply only to the stated samples and conditions. They are not a guarantee of performance, safety, efficacy or fitness for any product, market or use.You are responsible for checking the original reports and for meeting the laws and regulations of your market, including claims, labelling and registration.To the fullest extent permitted by law, KIWITA SDN. BHD. is not liable for any loss or damage arising from reliance on this page. Samples, specifications, quotations and prices are subject to a separate written agreement.

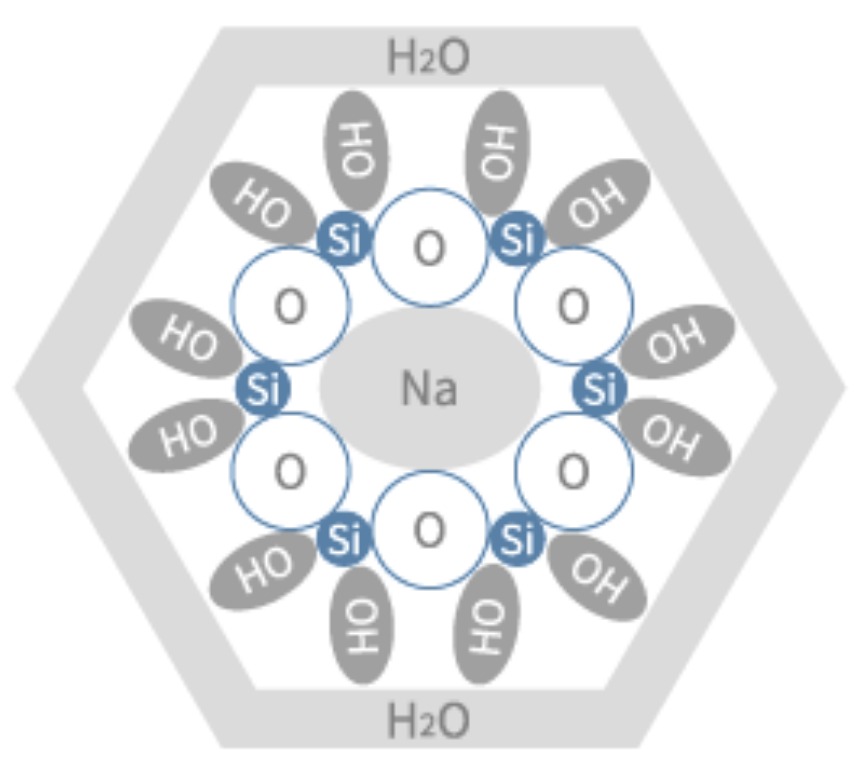
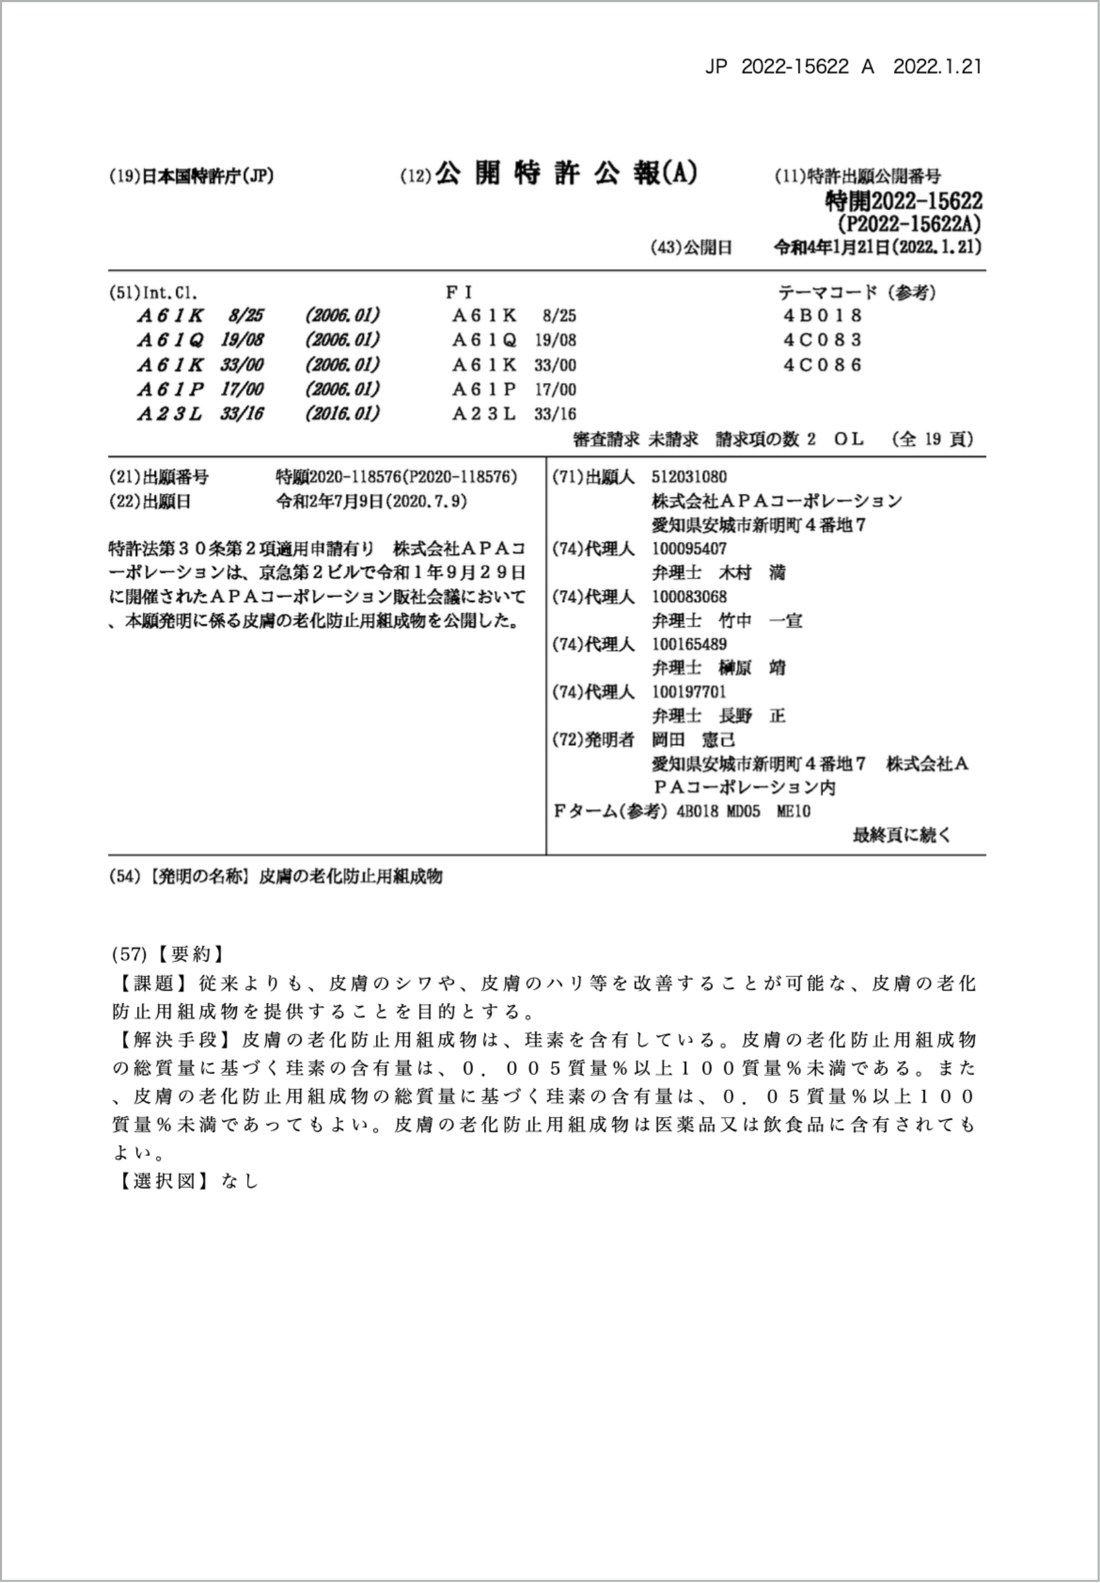
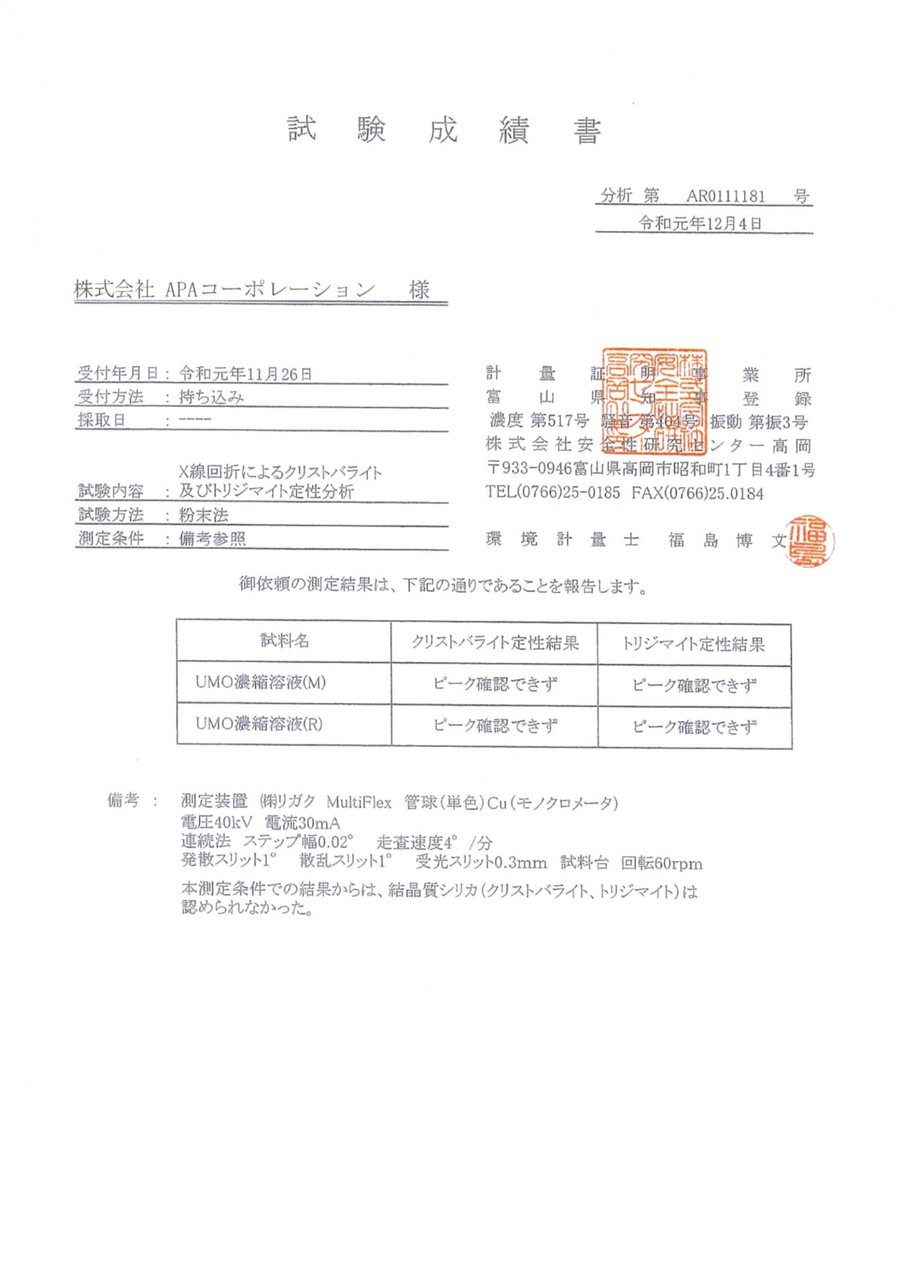 XRD testNon-crystalline silicon
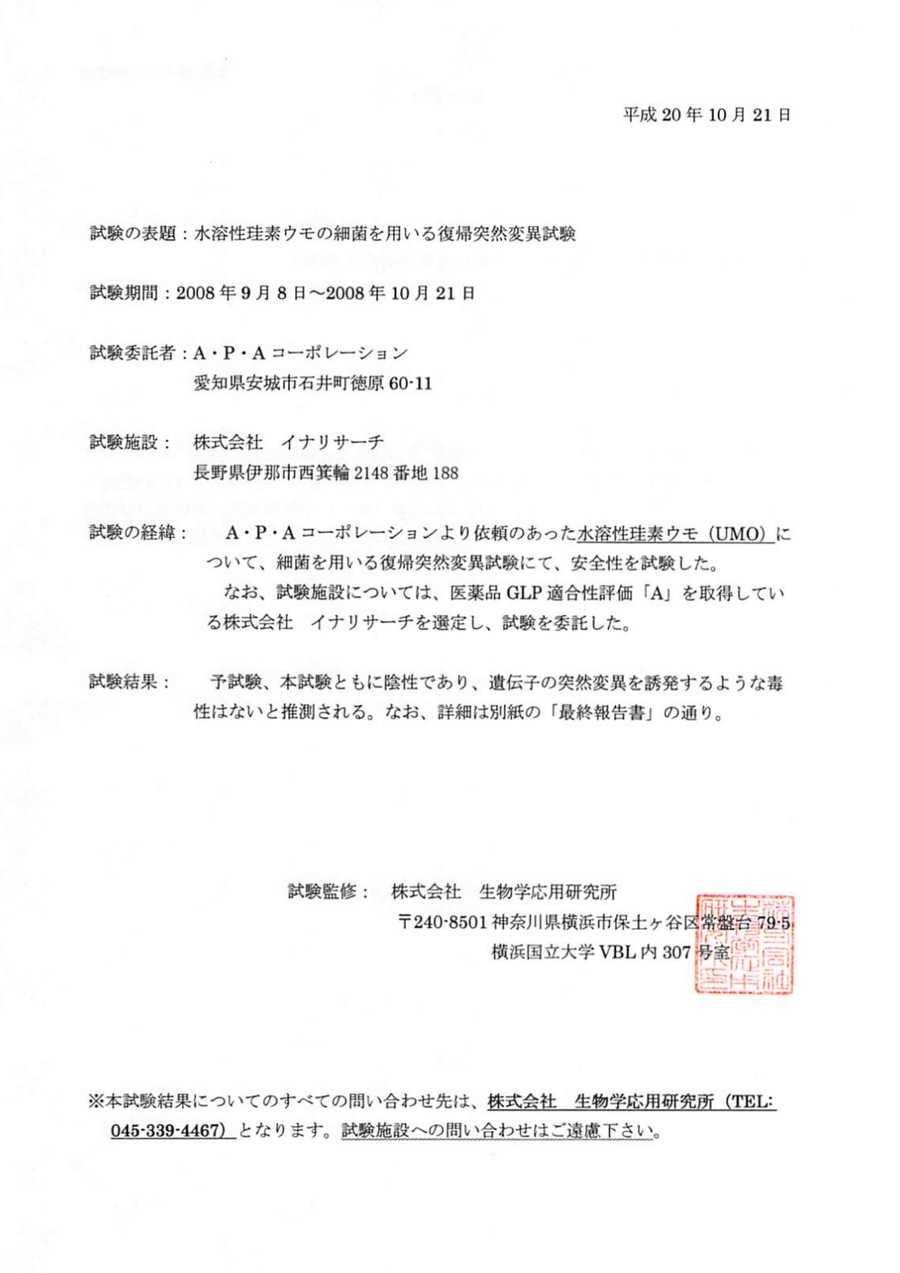 GLP studyNo genotoxic risk
 2 Oct 2026PFAS test (Shokukanken)
 15 Oct 2026Silicic acid 1.80% (JFRL)
 Anti-dopingNo active substance
 Halal (NAHA)
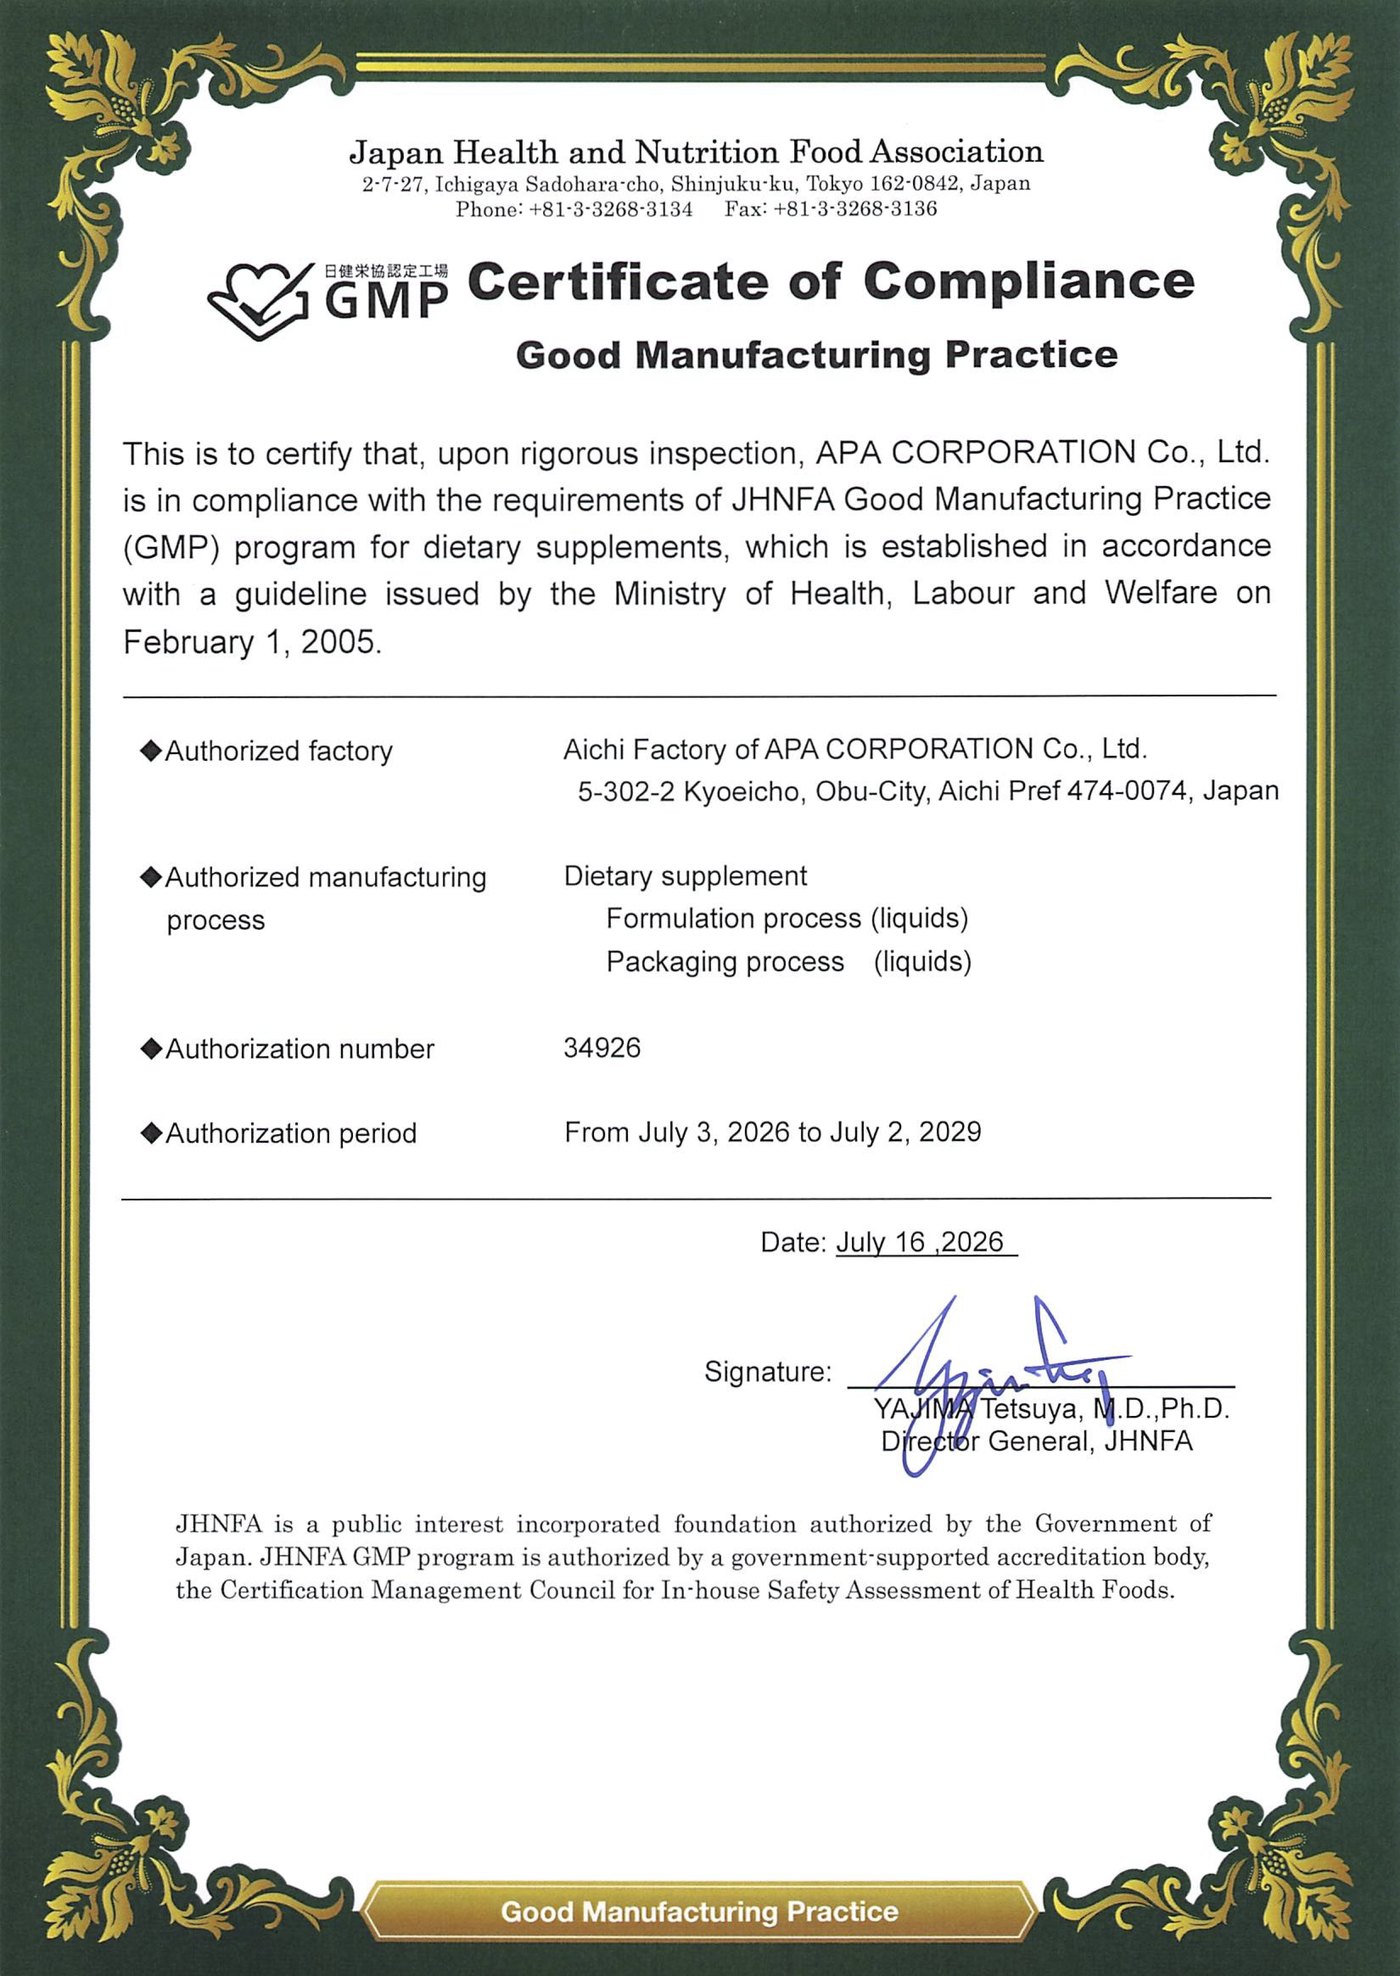 Valid to 2 Jul 2029JHNFA GMP, dietary supplements
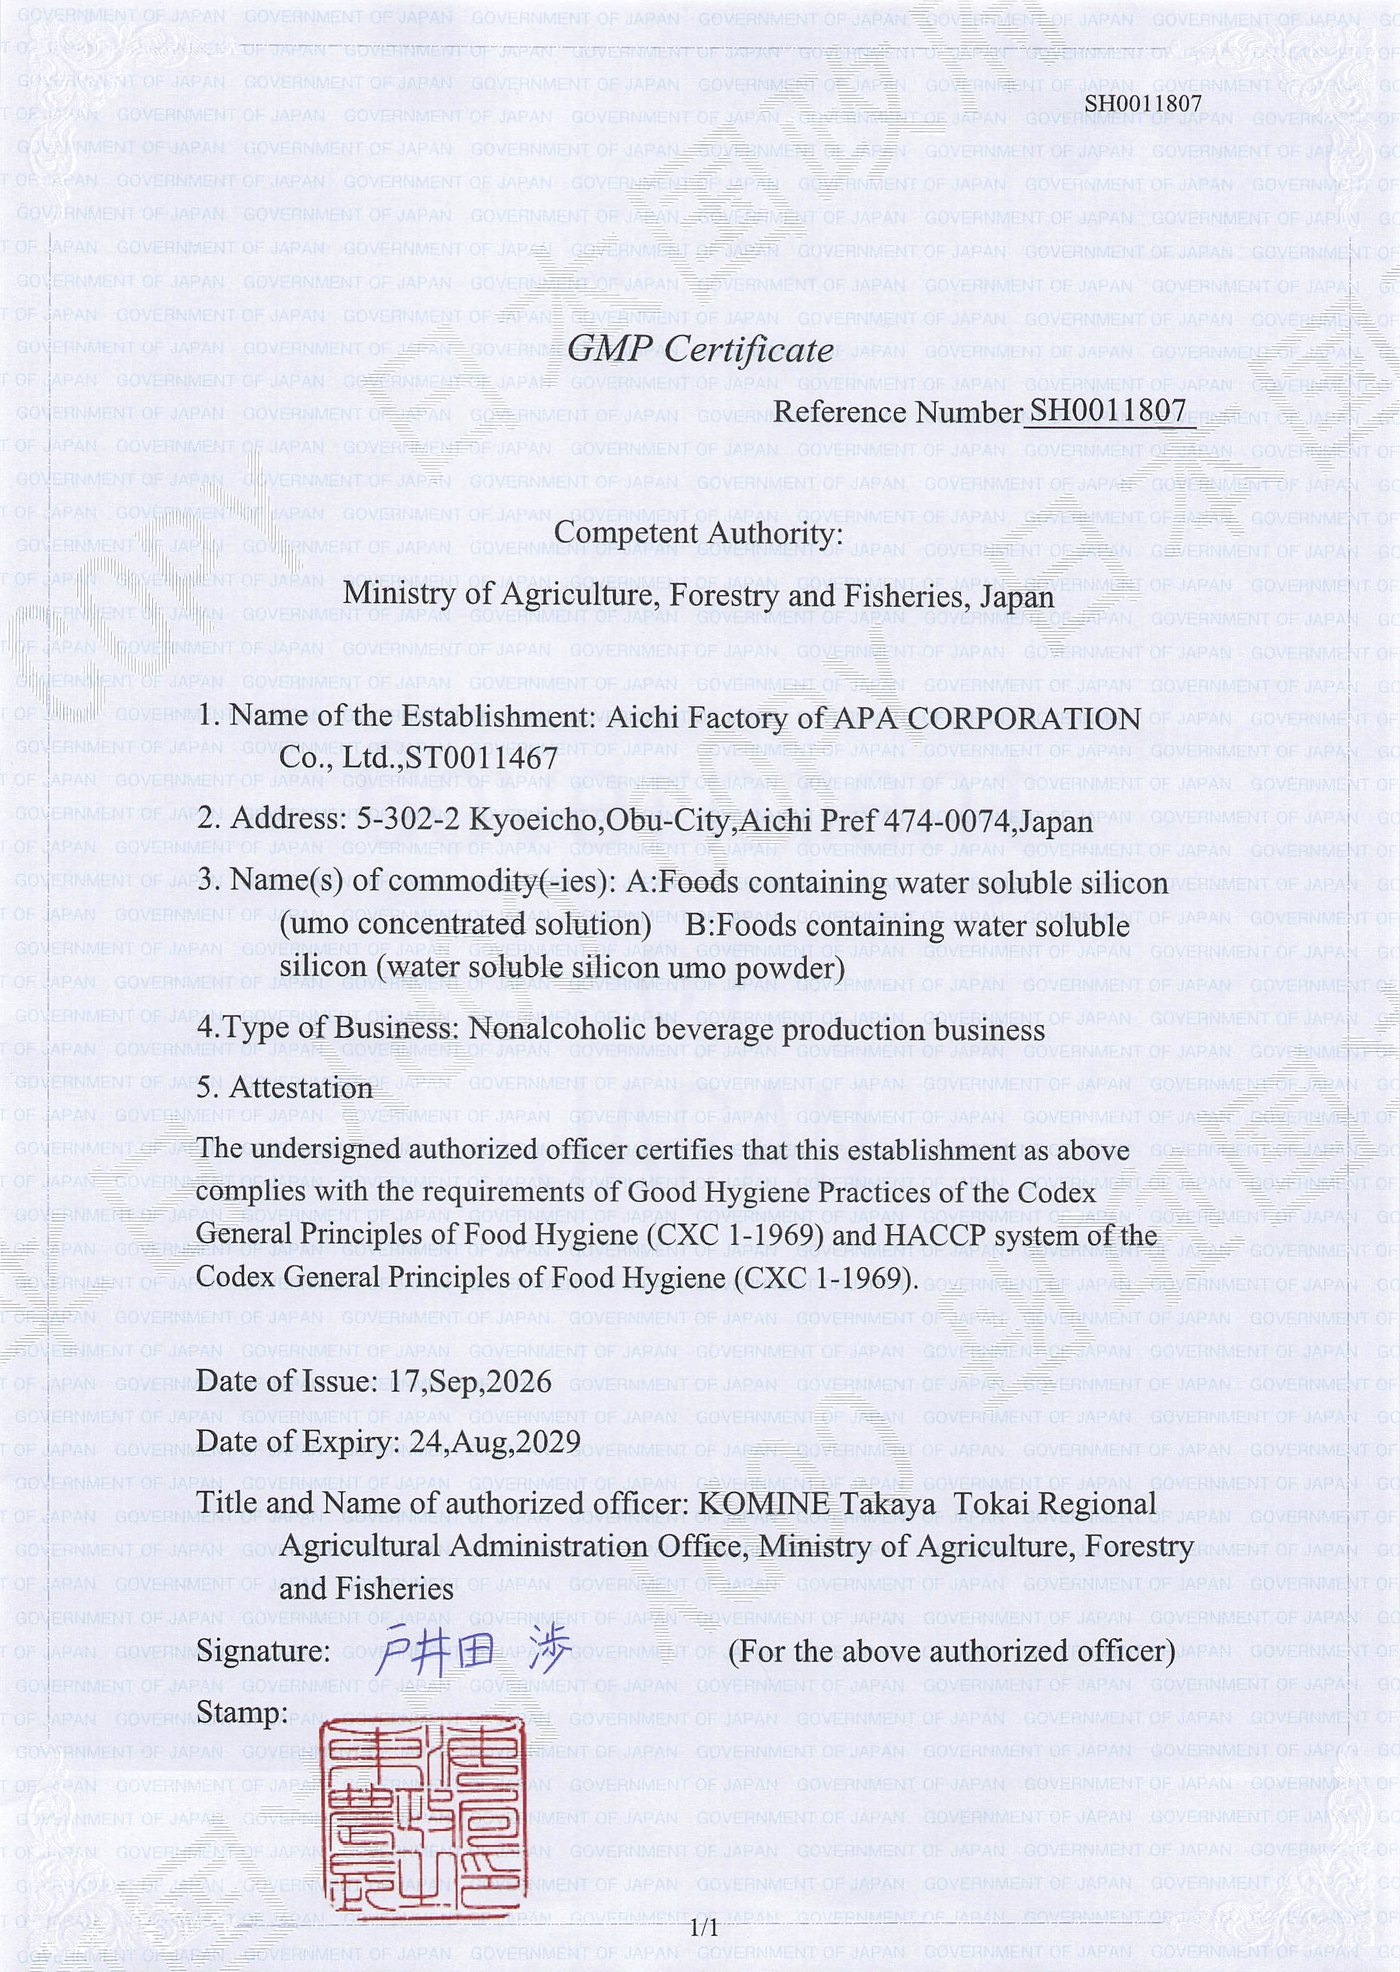 Valid to 24 Aug 2029MAFF GHP and HACCP
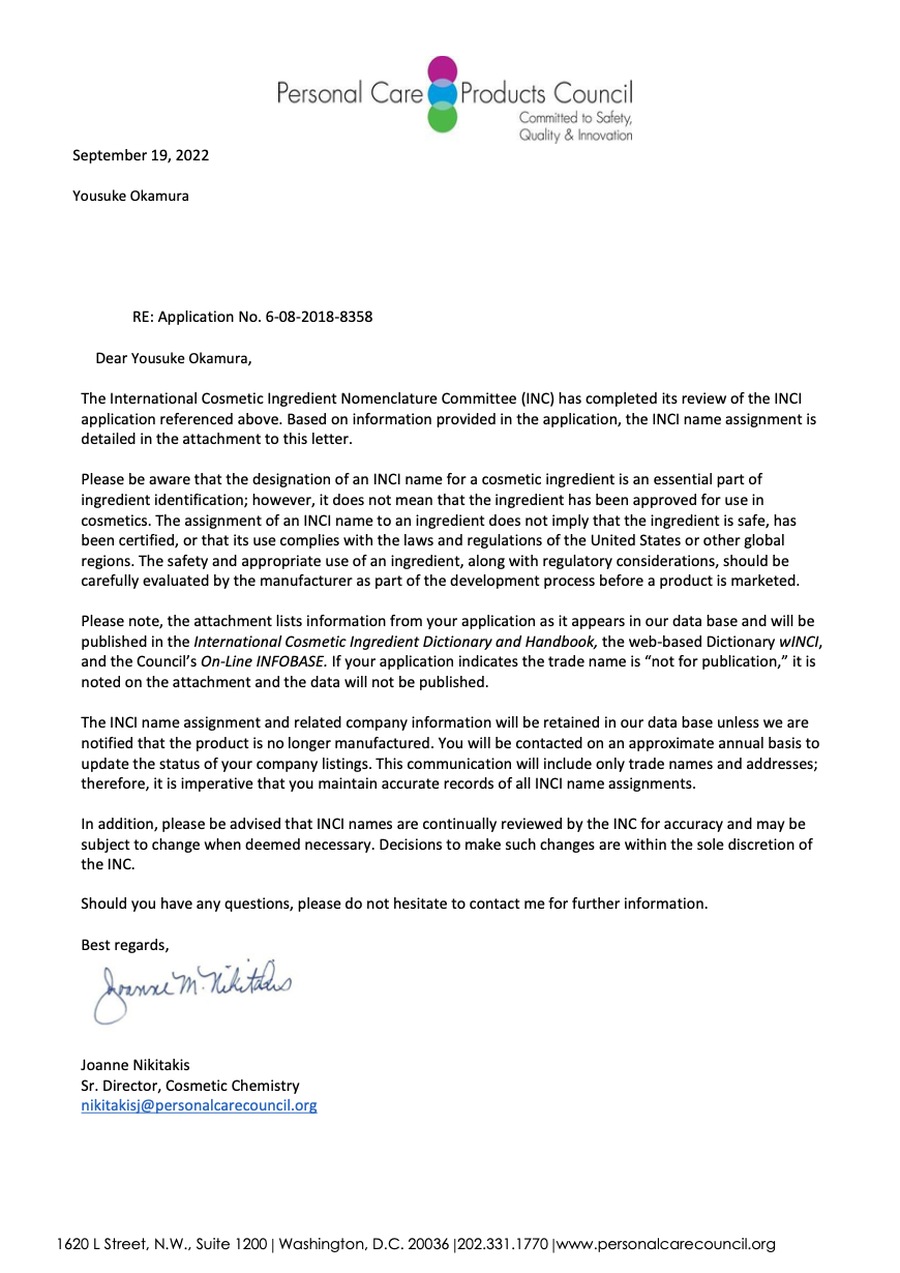 19 Sep 2022INCI name registration (PCPC)