Unproductive tillersShoots with no panicle use up nutrients for nothing; ↓ lower is better.
↓ 91.6%Unproductive tillers/plant, 3 & 4 L/ha
Per plant
8.3Control
2.71 L
3.32 L
0.73 L
0.74 L
Control vs 1–4 L/ha | sprays: pre-planting, day 30, day 60
Plots 1–5
Rice paddy
Rice paddy
Per ha
Control
1 L
2 L
3 L
4 L
Productive tillers/plant ↑
44
53.0 (+20.5%)
66.0 (+50.0%)
55.3 (+25.7%)
61.7 (+40.2%)
Unproductive tillers/plant ↓
8.3
2.7 (−67.5%)
3.3 (−60.2%)
0.7 (−91.6%)
0.7 (−91.6%)
Straw (t/ha) ↑
16.4
17.1 (+4.3%)
19.8 (+20.7%)
19.1 (+16.5%)
18.0 (+9.8%)
Grain (t/ha) ↑
2.8
6.4 (+128.6%)
7.3 (+160.7%)
7.4 (+164.3%)
8.1 (+189.3%)
( ) = vs control | tillers: average per plant | t/ha: calculated
APA Corporation. (2018). Pilot trial results of silica water as a plant nutrient supplement for rice. Pampanga State Agricultural University (Philippines).
TrialNiigata Agricultural Research Institute (2016)
TreatmentsNo application | 40 days before heading | 1st panicle fertiliser timing | at heading
JA Group3.85 M farmer members 6.36 M associates (FY2023)
NiigataNo. 1 rice output in Japan 637,900 t (2025)
Terms
Whole-grain ratioShare of complete, good-quality grains; higher is better.
SPADLeaf greenness; higher = darker green.
JA’s top-dressing timingStronger stems, better roots →Stable quality in hot years
40 daysBefore heading
JA message「品質向上に向けケイ酸追肥をお願いします!」“Please top-dress silicic acid to improve rice quality!”≈ 90% of silicic acid is absorbed after panicle initiation
Less lodging【Silicon builds up in stems → stems harden → less lodging】Silicon taken up by rice builds up in the stems and leaves, making the stems harder, so plants fall over less in heavy rain and strong wind.
Rice lodging | left control, right silicic acid
Lower plant temperature【Root activity ↑ → more water uptake and transpiration → plant temperature ↓】Stronger roots take up more water. As the leaves release this water, it carries heat away and cools the plant.
Thermal images | left control, right silicic acid
① Silicic Acid in Stems & Leaves (%)At maturity | low-silicon fieldAll 3 top-dressed groups ↑ vs no application
6.1
6.7
8.0
6.4
2014
6.1
6.5
6.3
6.9
2015
② Leaf Colour (SPAD) in RipeningAug–Sep 2014 | higher = darker green40-days-before group darkest through ripening
③ Whole-Grain Ratio (%)2014–2015High temp.: ≈ 52% (none) → ≈ 65% (40 days before)
72.8
79.5
80.5
72.8
Normal temperature
52.3
65.0
62.2
62.1
High-temperature treatment
No application40 days before heading1st panicle fertiliser timingAt heading
Niigata Agricultural Research Institute (2016) | 4 treatments compared | values read from the original figures, approximate
Item
No application
Top-dressed
Silicic acid in stems & leaves (maturity)
—
↑ (all 3 groups)
Leaf colour (SPAD), ripening 2014
—
Darkest at 40 days before heading
Whole-grain ratio, hot years (2014–2015)
≈ 52%
≈ 65% (40 days before heading)
Plant temperature
—
Lower (thermal images)
Values read from figures | approximate
JA / JA ZEN-NOH Niigata. (2021, May 14). Farming Report Niigata: Effects of Mid-Season Top-Dressing and Recommended Materials (in Japanese).Niigata Agricultural Research Institute. (2016). Reducing Quality Loss in Hot Ripening Seasons by Top-Dressing Silicic Acid Before Heading (in Japanese).JA Group, JA FACT BOOK (FY2023); MAFF, Prefecture Profile 2026 (Niigata).
Dose2–5 L/ha (0.7 | 1.0 | 1.3 | 1.7 L per 20 m² per spray)
Sprays3 × | pre-transplant, day 20, day 40 after transplanting
PurposeBAF application evaluation test
SitePampanga State Agricultural University, Philippines
InvestigatorDr. Norman
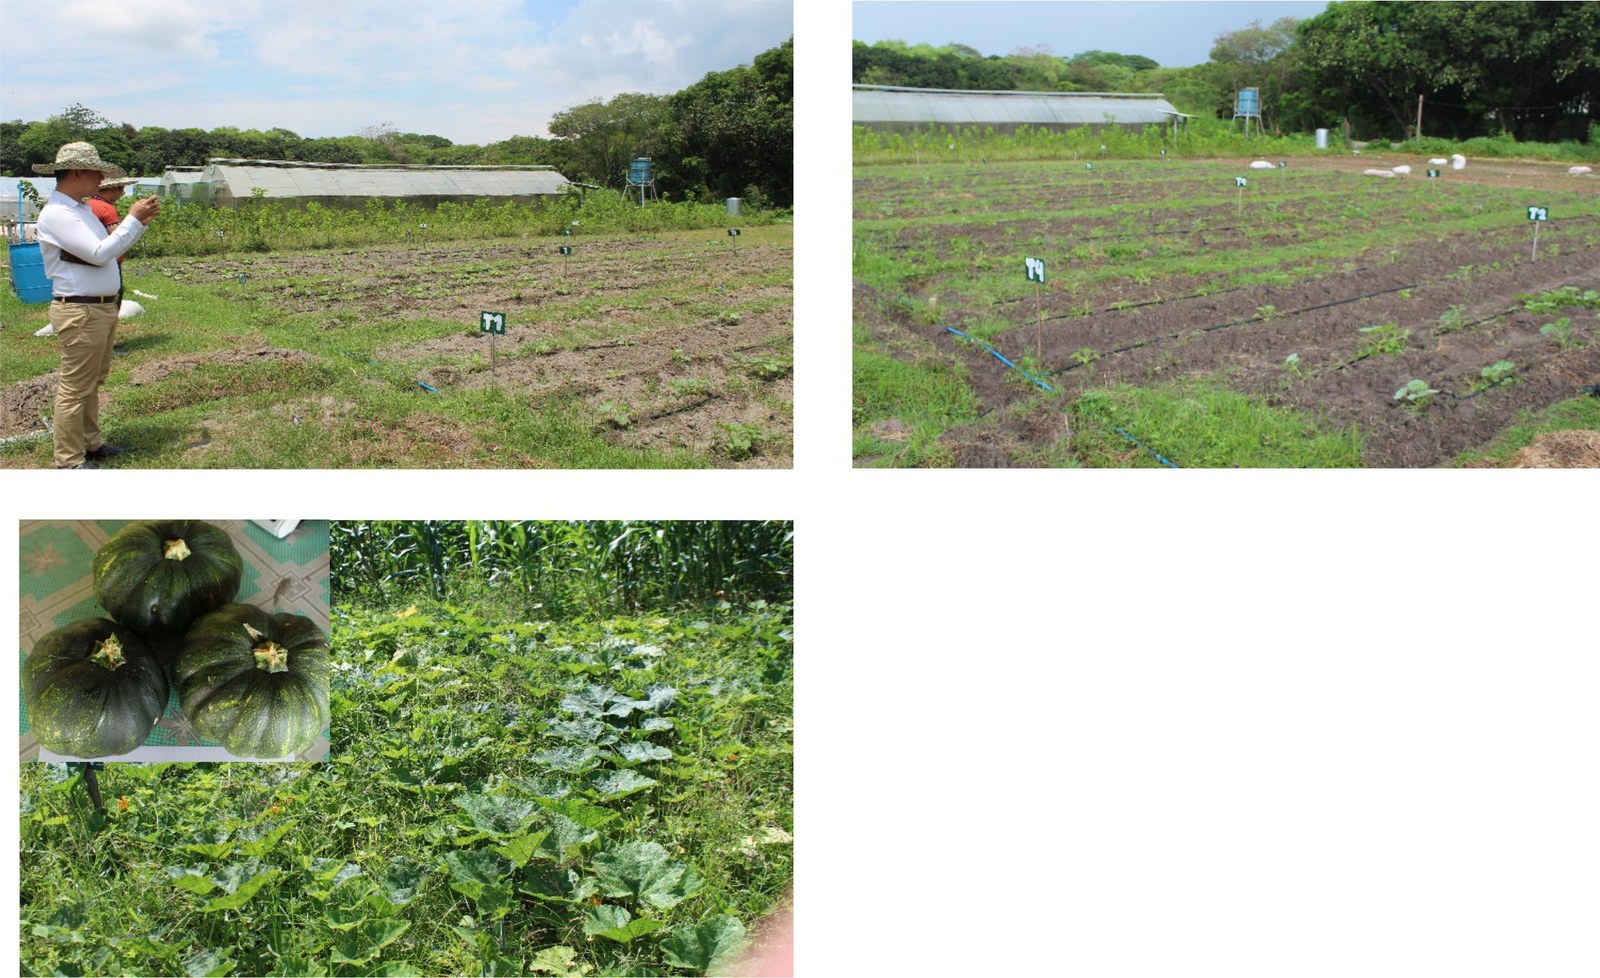
All 4 crops yielded most at 4 L/ha; 5 L/ha gave less. Yardlong bean, squash and tomato grew tallest at 3 L/ha, sweet sorghum at 4 L/ha. No n or stats.
Terms
DATDays after transplanting.
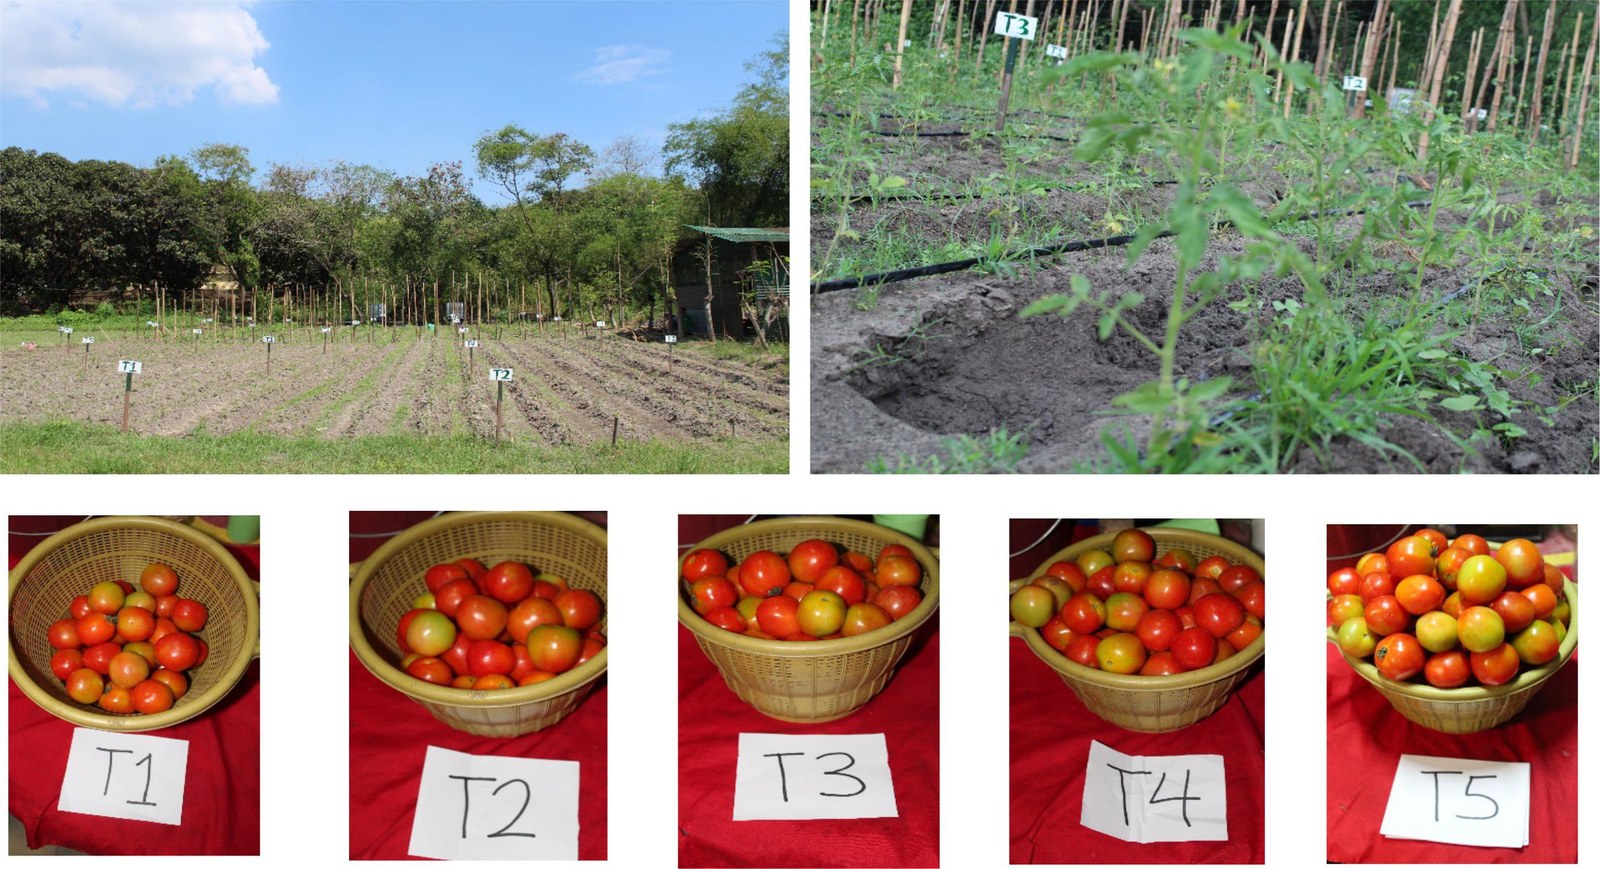
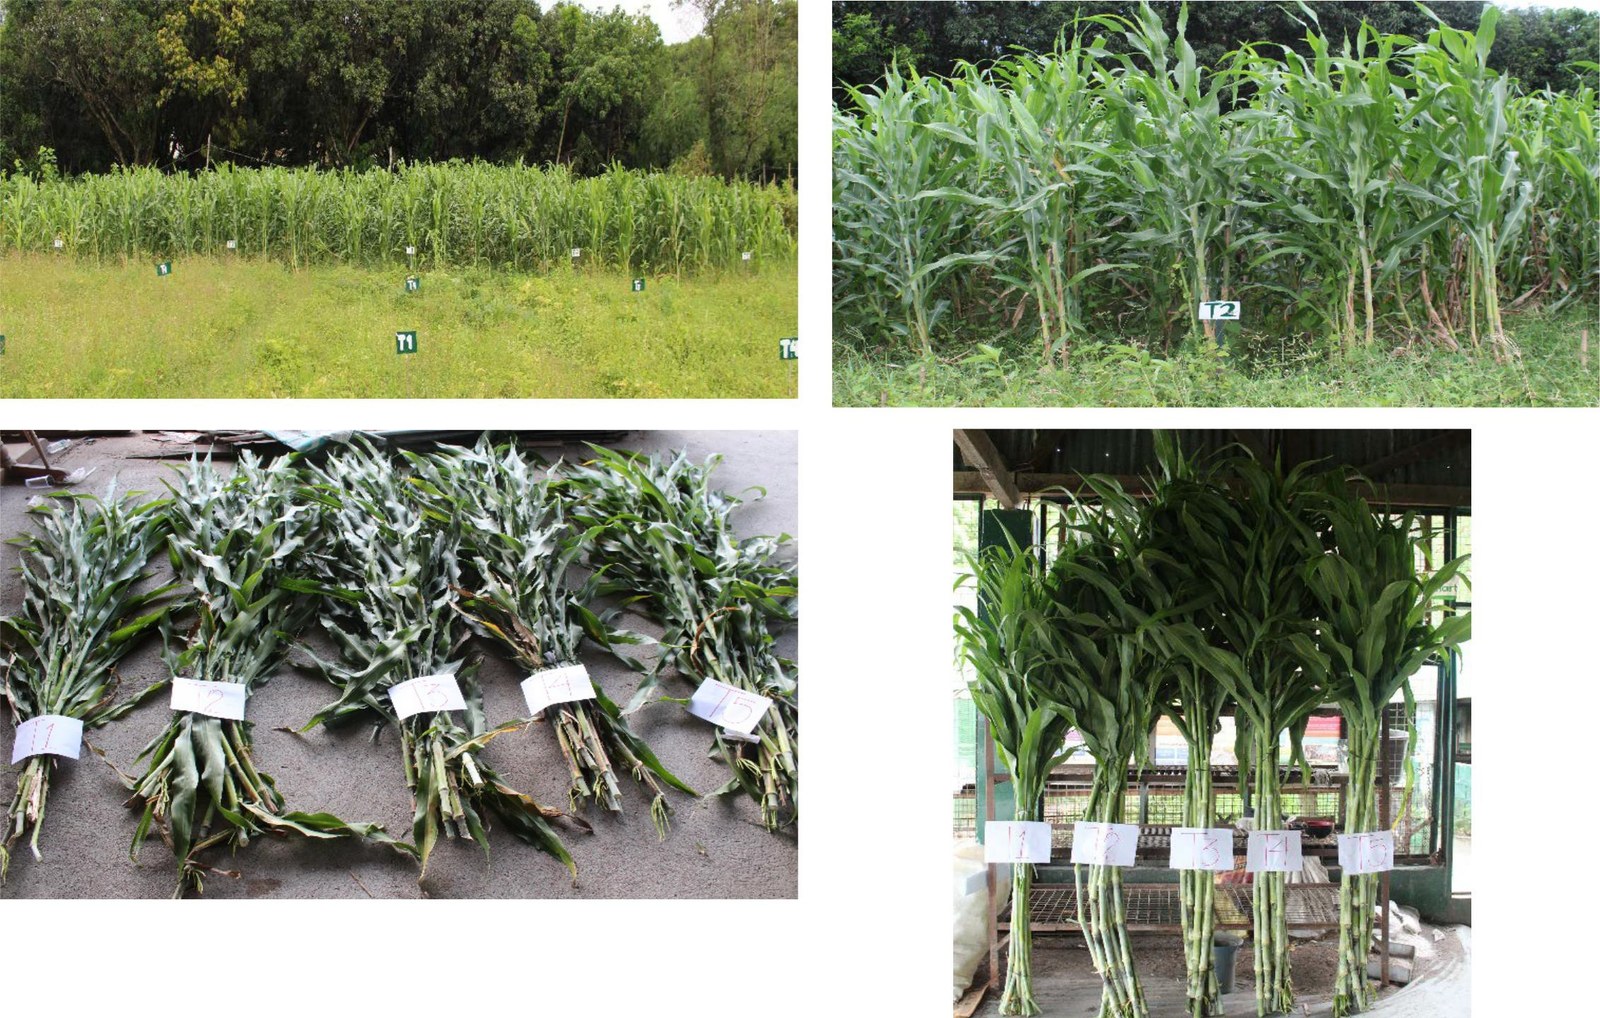
T1–T5Control, then 2 / 3 / 4 / 5 L/ha (total of 3 sprays).
Yardlong Bean (Pole Sitao)
YieldPlant UMO® promotes plant growth →Yield per area ↑ →More harvest from the same field
↑ 152.8%Yield, 4 L/ha vs control (3.60 → 9.10 t/ha)
Yield, t/ha
3.60Control
4.812 L
7.633 L
9.104 L
5.755 L
Plant heightAll treated groups grew taller than the control
↑ 50.3%Plant height, 30 DAT, 3 L/ha
Height, cm
86.50Control
120.252 L
130.003 L
120.004 L
115.755 L
Treatment
Height, cm
Yield per 20 m², kg
Yield, t/ha
T1 Control
86.50
7.28
3.60
T2 2 L/ha
120.25 (+39.0%)
9.61
4.81 (+33.6%)
T3 3 L/ha
130.00 (+50.3%)
15.25
7.63 (+111.9%)
T4 4 L/ha
120.00 (+38.7%)
18.20
9.10 (+152.8%)
T5 5 L/ha
115.75 (+33.8%)
11.50
5.75 (+59.7%)
( ) = vs control | no n or stats
Test area | flowering stage | harvest
Squash
YieldPlant UMO® promotes plant growth →Yield per area ↑ →More harvest from the same field
8.9 t/haHighest yield, 4 L/ha | control bore no fruit
Yield, t/ha
No fruitControl
6.252 L
8.283 L
8.884 L
7.885 L
Plant heightAll treated groups grew taller than the control
↑ 87.4%Plant height, 30 DAT, 3 L/ha
Height, cm
45.50Control
75.852 L
85.253 L
75.754 L
80.505 L
Treatment
Height, cm
Yield per 20 m², kg
Yield, t/ha
T1 Control
45.50
No fruit
No fruit
T2 2 L/ha
75.85 (+66.7%)
12.50
6.25
T3 3 L/ha
85.25 (+87.4%)
16.55
8.28
T4 4 L/ha
75.75 (+66.5%)
17.75
8.88
T5 5 L/ha
80.50 (+76.9%)
15.75
7.88
( ) = vs control | no n or stats
Test area | harvest
Tomato
YieldPlant UMO® promotes plant growth →Yield per area ↑ →More harvest from the same field
↑ 242.4%Yield, 4 L/ha vs control (1.98 → 6.78 t/ha)
Yield, t/ha
1.98Control
4.132 L
5.633 L
6.784 L
4.925 L
Plant heightAll treated groups grew taller than the control
↑ 48.4%Plant height, 30 DAT, 3 L/ha
Height, cm
40.50Control
55.502 L
60.103 L
57.504 L
50.505 L
Treatment
Height, cm
Yield per 20 m², kg
Yield, t/ha
T1 Control
40.50
3.96
1.98
T2 2 L/ha
55.50 (+37.0%)
8.25
4.13 (+108.6%)
T3 3 L/ha
60.10 (+48.4%)
11.50
5.63 (+184.3%)
T4 4 L/ha
57.50 (+42.0%)
13.55
6.78 (+242.4%)
T5 5 L/ha
50.50 (+24.7%)
9.85
4.92 (+148.5%)
( ) = vs control | no n or stats
Test area | T1–T5 harvest
Sweet Sorghum
YieldPlant UMO® promotes plant growth →Yield per area ↑ →More harvest from the same field
↑ 155.2%Yield, 4 L/ha vs control (31.73 → 80.96 t/ha)
Yield, t/ha
31.73Control
70.182 L
77.283 L
80.964 L
79.535 L
Plant heightAll treated groups grew taller than the control
↑ 22.1%Plant height, 60 DAT, 4 L/ha
Height, cm
239.96Control
288.572 L
285.093 L
292.944 L
269.345 L
Treatment
Height, cm
Yield per 20 m², kg
Yield, t/ha
T1 Control
239.96
0.577
31.73
T2 2 L/ha
288.57 (+20.3%)
1.276
70.18 (+121.2%)
T3 3 L/ha
285.09 (+18.8%)
1.405
77.28 (+143.6%)
T4 4 L/ha
292.94 (+22.1%)
1.472
80.96 (+155.2%)
T5 5 L/ha
269.34 (+12.2%)
1.446
79.53 (+150.6%)
( ) = vs control | no n or stats
Test area | T1–T5 plants at harvest
Effect of Silica Water on Vegetable Growth: Evaluation Trial for BAF Application. Pampanga State Agricultural University (Republic of the Philippines). Investigator: Dr. Norman.
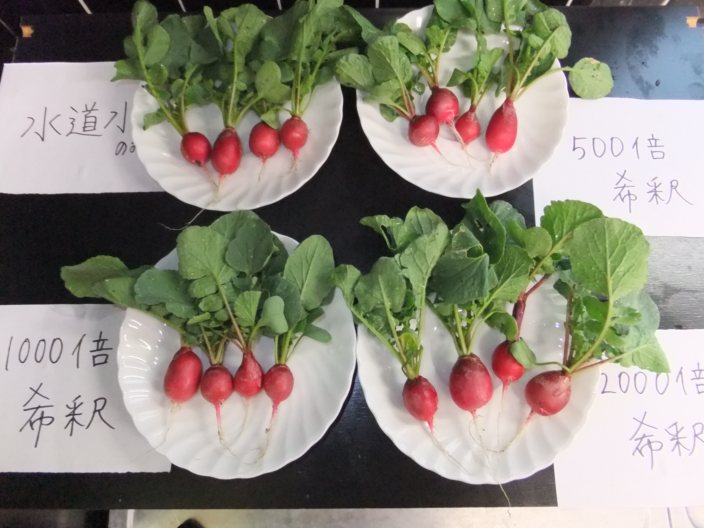
DoseUMO® 1,500× | 3,000× | 6,000× Control: tap water
Water500 mL/day
Period24 days May 12 → June 5, 2015
SourceAPA Corporation
1,500× was too strong: 4 plants, 46 g. No n or stats.
Total harvest weightPlant UMO® at 6,000× raises total harvest weight →More large radishes
↑ 16.9%Total harvest weight, 6,000× vs tap water
Total weight, g
142Tap water
461,500×
1363,000×
1666,000×
Pot | 500 mL/day | 24 days
Harvest, day 24
Harvest, day 24
Group
Plants
Total (g)
Avg/plant (g)
① Tap water (control)
14
142
10.1
② UMO® 1,500×
4
46 (−67.6%)
11.5 (+13.9%)
③ UMO® 3,000×
14
136 (−4.2%)
9.7 (−4.0%)
④ UMO® 6,000×
15
166 (+16.9%)
11.0 (+8.9%)
( ) = vs control | no n or stats
APA Corporation. (2015). Pot cultivation of radish. APA Corporation.Okada, K. (2018, February 8). Method for producing improved soil and method for cultivating plants using improved soil (Japanese Patent Application Publication No. 2018-19650). APA Corporation.
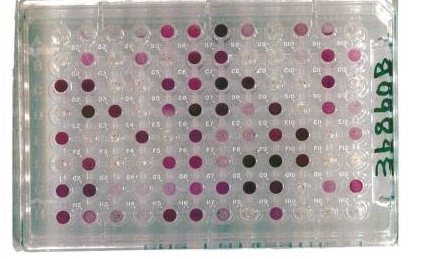
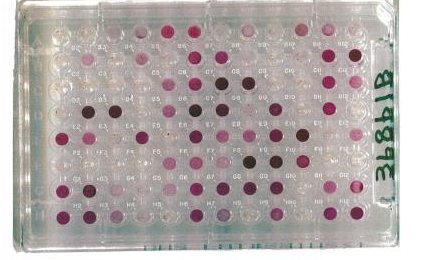
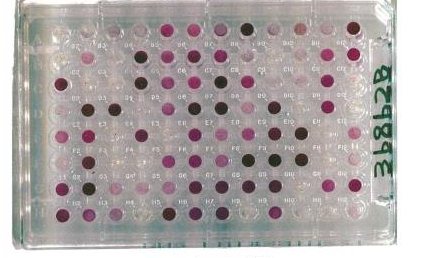
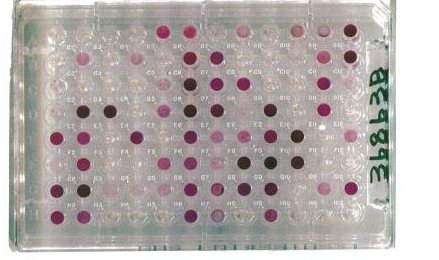
↑ 19.5%Microbial diversity & activity, 9,000× vs control
Value
959,225Control
914,2013,000×
1,146,2639,000×
978,05415,000×
Headline = best dilution | 3,000× below control
Control
UMO® 3,000×
UMO® 9,000×
UMO® 15,000×
Group
Value
T-score
Control (tap water)
959,225
54.9
UMO® 3,000×
914,201 (−4.7%)
53.6 (−1.3)
UMO® 9,000×
1,146,263 (+19.5%)
60.0 (+5.1)
UMO® 15,000×
978,054 (+2.0%)
55.4 (+0.5)
( ) = vs control | no n or stats
Value
Soil condition
For plants
1.5–2 million
Extremely rich
Excellent growing environment
1.3–1.5 million
Very rich
Supports growth & quality
1.0–1.3 million
Rich
Supports healthy growth
0.7–1.0 million
Good
Fairly stable growing environment
0.5–0.7 million
Average
Average growing environment
0.3–0.5 million
Weak
Low microbial activity; soil may need improving
Below 0.3 million
Low
Low microbial activity; soil may not support plant growth
Reference ranges of the soil microbial index
APA Corporation. (2016). Soil Microbial Diversity and Activity Test. APA Corporation, Japan. Test report samples No. 36860–36863; soil samples collected on January 15, 2016.Okada, K. (2018, February 8). Method for producing improved soil and method for cultivating plants using improved soil (Japanese Patent Application Publication No. 2018-19650). APA Corporation.
Mushroom-block trialSilicic acid mist keeps blocks moist →Bigger caps, more count and weight →Stronger aroma, savoury and juicy
3 roundsTap water vs silicic acid 100×
Round 1
Round 2
Round 3
Round
Dates | harvest day
Silicic acid vs tap water
1
23–27 Oct 2017 | day 5
Bigger caps, more count and weight
2
14–24 Nov 2017 | day 11
Sprouted first (day 4); some caps same size, more harvested
3
13 Dec 2017 – 5 Jan 2018 | day 24
Tap water sprouted 1–2 days earlier; silicic acid gave more weight, bigger mushrooms
Taste
Tasting feedback
Silicic acid: strong aroma, savoury, juicy; tap water: weaker aroma, watery, smaller; store-bought: weakest aroma, each one large (may depend on freshness)
APA Corporation. (2017–2018). Shiitake cultivation test.
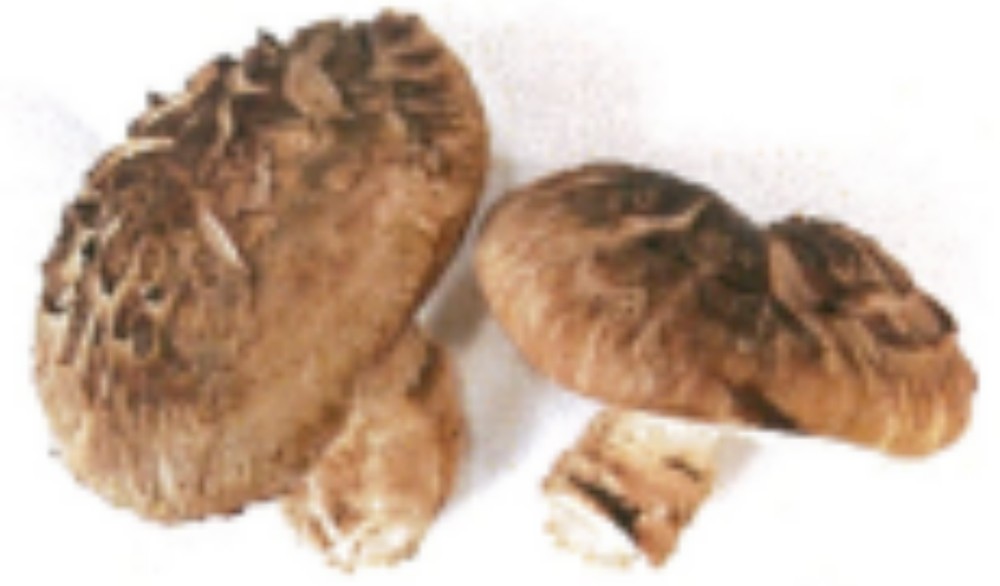
Radioactive Cesium: Shiitake Washing
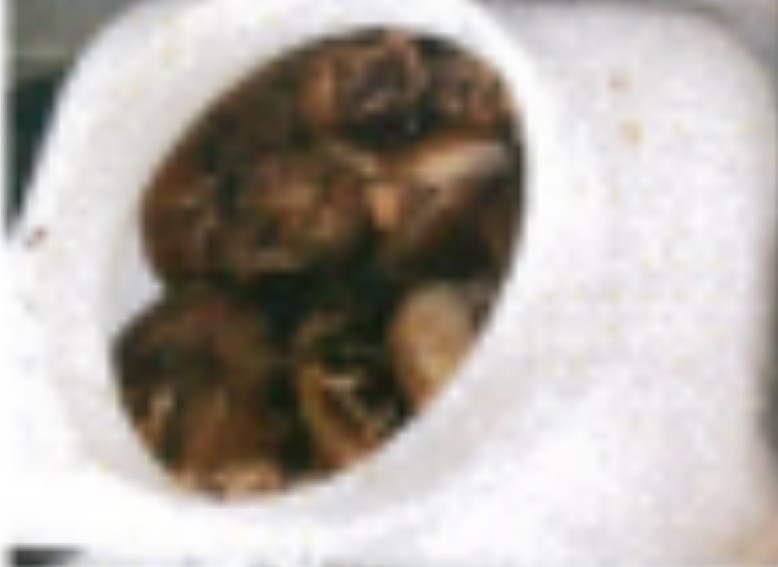
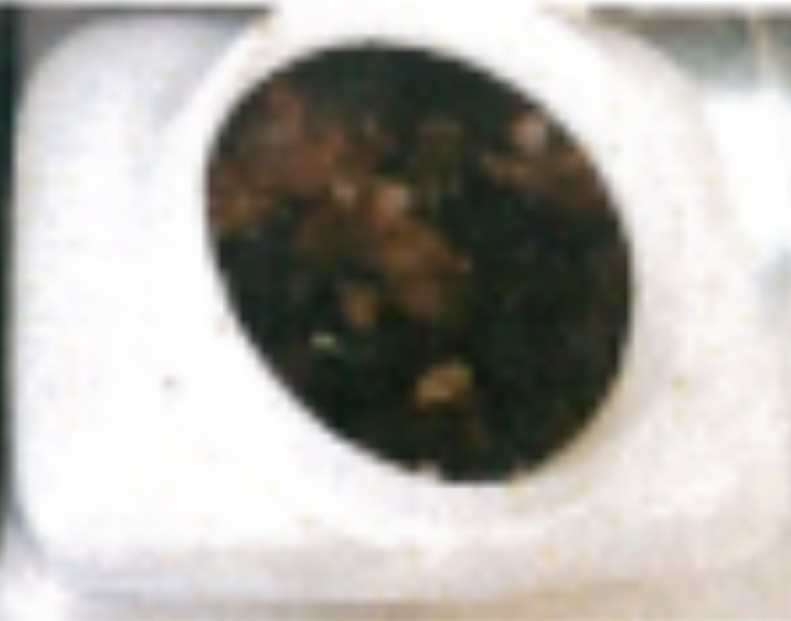
Washing test
SampleLog-grown shiitake ≈ 2.5 kg/group
WashUMO® 10× 60 min in 6,000 mL
Measured2014-04-23 / 04-30 germanium detector
Basis1 measurement each no stats
SourceAPA Corporation
Before-wash value measured by another lab and device (2014-04-23).
Terms
Radioactive cesium (Cs-134, Cs-137)Main radioactive substances released in nuclear accidents; easily absorbed by mushrooms. ↓ lower is better.
Iodine-131Another radioactive substance from nuclear accidents; halves in about 8 days.
Bq/kgRadioactivity per kg of food. ↓ lower is better.
Japan food standardRadioactive cesium 100 Bq/kg or below.
Total radioactive cesiumPlant UMO® washing removes about 2 in 10 more radioactive cesium than pure water →Less residue on the food →Greater peace of mind
↓ 23.4%Total radioactive cesium, UMO® 10× vs pure-water wash
Bq/kg
803Before wash
410Pure water
314UMO® 10×
Japan food standard 100 Bq/kg
Shiitake
① Pure water wash
② UMO® 10% wash
Item
Before
Pure water
UMO® 10×
Cs-134 ↓
—
110
84 (−23.6%)
Cs-137 ↓
—
300
230 (−23.3%)
Total cesium ↓
803
410
314 (−23.4%)
Iodine-131
—
Not detected
Not detected
Bq/kg | ( ) = vs pure water | not detected = < 5.0 | JP standard 100 | no stats
APA Corporation. (2014, April 30). Radioactive Substance Analysis Test: Shiitake Mushrooms. Food Development Center SUNATEC.
vs pure water ↓ 9.4% (203 → 184); may be measurement error. Pre-check 242 (2013-12-10).
Terms
Cs / Iodine-131 / Bq/kgAs in the shiitake test. Iodine-131 is usually not detected after 2+ years.
Japan food standardRadioactive cesium 100 Bq/kg or below.
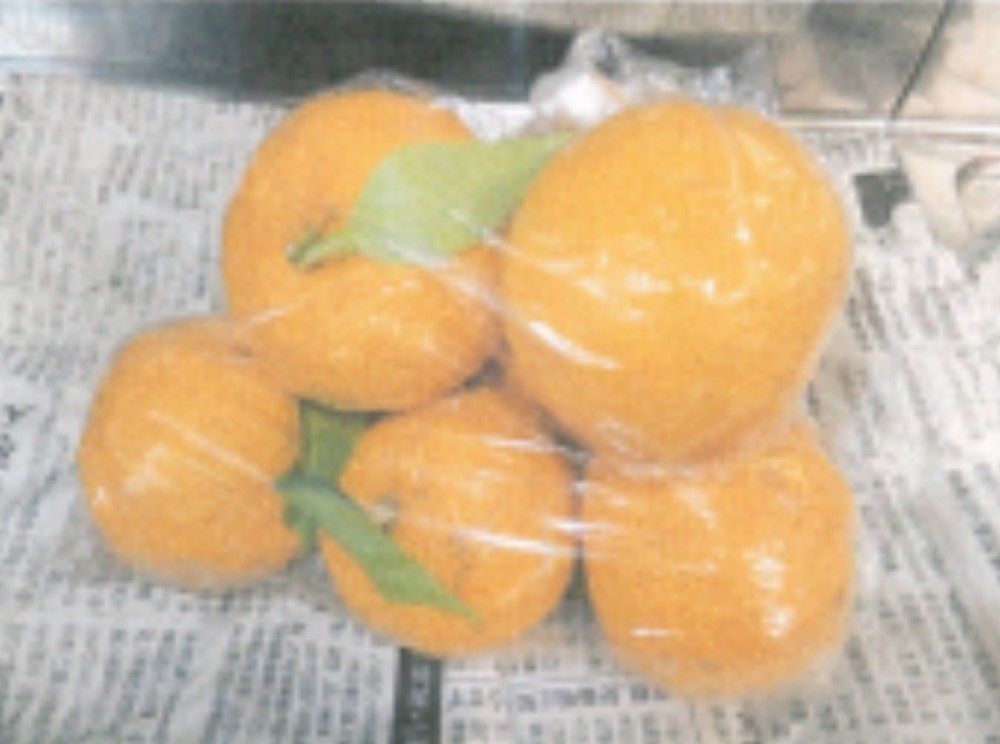
Total radioactive cesiumPlant UMO® washing removes about 1 in 10 more radioactive cesium than pure water →Less residue on the food →Greater peace of mind
↓ 14.8%Total radioactive cesium, UMO® 10× vs unwashed
Bq/kg
216Unwashed
203Pure water
184UMO® 10×
Japan food standard 100 Bq/kg
Yuzu
Item
Unwashed
Pure water
UMO® 10×
Cs-134 ↓
66
63 (−4.5%)
54 (−18.2%)
Cs-137 ↓
150
140 (−6.7%)
130 (−13.3%)
Total cesium ↓
216
203 (−6.0%)
184 (−14.8%)
Iodine-131
Not detected
Not detected
Not detected
Bq/kg | ( ) = vs unwashed | not detected = < 5.0 | no stats
APA Corporation. (2013, December 17). Radioactive Substance Analysis Test: Yuzu. Food Development Center SUNATEC.
5,000–8,000×Dilution, all stages | seedlings included
Dilute 5,000–8,000× →Spray every 7–14 days (rice 7–10) →Healthy crop, less stress
Crop
Stage
Interval
Effects
Rice
Establishment → harvest
7–10 days
Stronger stems, better leaf posture, more stress tolerance, yield ↑
Strawberry
Planting → peak harvest
7–14 days
Firm fruit, sugar ↑, longer shelf life
Apple
Fruit set → ripening
7–14 days
Less stress damage, firmer fruit, colour ↑, sugar ↑
Tomato
Seedling → harvest
7–14 days
Healthy fruit, less stress, yield and taste ↑
Cucumber
Growth → harvest
7–14 days
Less stress damage, fewer curved fruits, longer shelf life
Cabbage
Head forming → harvest
7–14 days
Less stress damage, firmer heads
Green onion
Growth → harvest
7–14 days
Upright leaves, firmer neck, yield ↑
Carrot
Growth → harvest
7–14 days
Healthy growth, upright leaves, firmer top
Effects as described in the product leaflet | not trial results
APA Corporation. Plant UMO leaflet: application examples by crop.The 5,000–8,000× rate is KIWITA's recommendation (Japan registered label: 3,000–8,000×).
What Is Silicic Acid? How Plants Take It In
Silicic acid is silicon combined with water (silicon + oxygen + hydrogen).
Si
Silicon
Crystallised Pure element
+ O₂− O₂
SiO₂
Silica
Crystallised Crystal, sand, rock
+ H₂O− H₂O
H₂SiO₃
Metasilicic acid
≠ Amorphous Transient form
+ H₂O− H₂O
H₄SiO₄
Orthosilicic acid
Amorphous In food and water, as a trace mineral
In nature, it takes 100–1,000 years for crystalline silicon to turn into amorphous silicon through chemical weathering.
Crystallised›Amorphous
Iler, R. K. (1979). The Chemistry of Silicon. Wiley-Interscience.
How Plant UMO® Is Made: Patented Structure
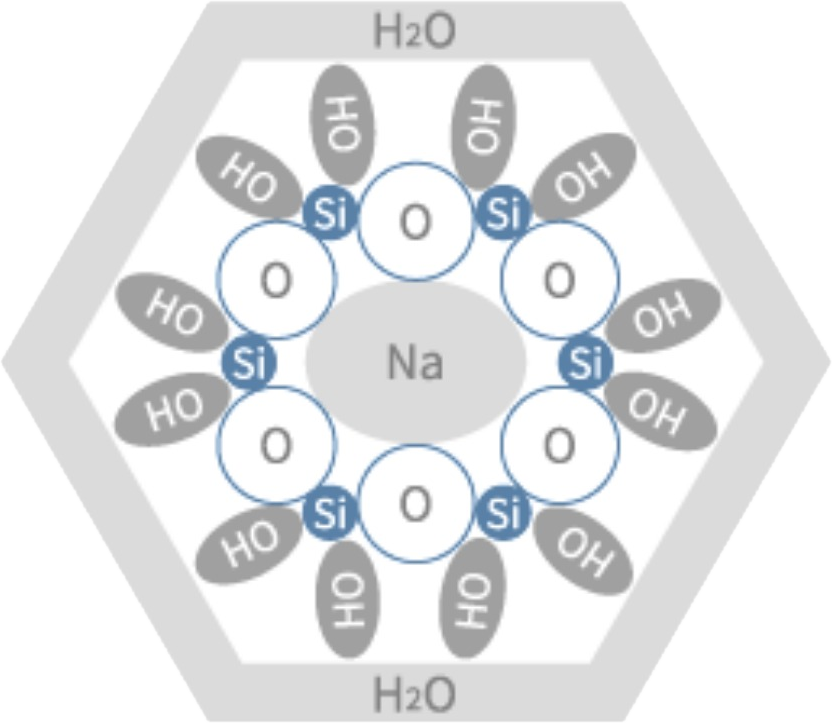
UMO’s patented technology reshapes single silicic acid into a six-sided ring: hexagonal oligomeric silicic acid, Si₆O₆(OH)₁₂.
FormulaSi₆O₆(OH)₁₂
StructureHexagonal ring
TypeOligomeric silicic acid
Size0.8–1.0 nm
Molecular weight468.6 Da
Before use✓
Stays stableLiquid stays clear. No crystals while stored.
After use✓
Taken up by rootsPlants take up dissolved single silicic acid (H₄SiO₄, 0.4 nm) through the root silicon channel, then it moves up to the whole plant.
Japanese patent publications
JP 2023-152390 APublished 17 Oct 2023Method for producing water-soluble silicon solution
JP 2022-015622 APublished 21 Jan 2022Composition for preventing skin aging
JP 2018-090611 APublished 14 Jun 2018Method of use for a water-soluble solution containing edible silicon
JP 2018-191599 APublished 6 Dec 2018Method for raising livestock and feed additive
JP 2018-19650 APublished 8 Feb 2018Method for producing improved soil and method for cultivating plants using improved soil
Ma et al., 2006. A silicon transporter in rice. Nature. https://doi.org/10.1038/nature04590 Saitoh et al., 2021. Structural basis for high selectivity of a rice silicon channel Lsi1. Nature Communications. https://doi.org/10.1038/s41467-021-26535-x
Hexagonal Water Is Also Bioactive for Plants
Water molecules link into tiny hexagon networks. A hexagonal molecule fits that network, so it stays stable in liquid.
Water molecules (H₂O) link into a hexagon network.
Product Stability
TheoryProf. Nakajima, colloid theory→Hexagonal structures are relatively stable in liquid
WaterWater is H₂O→H₂O molecules join at 120°→Forming a hexagon structure
UMOHexagonal molecule→Fits the water network→More stable in liquid
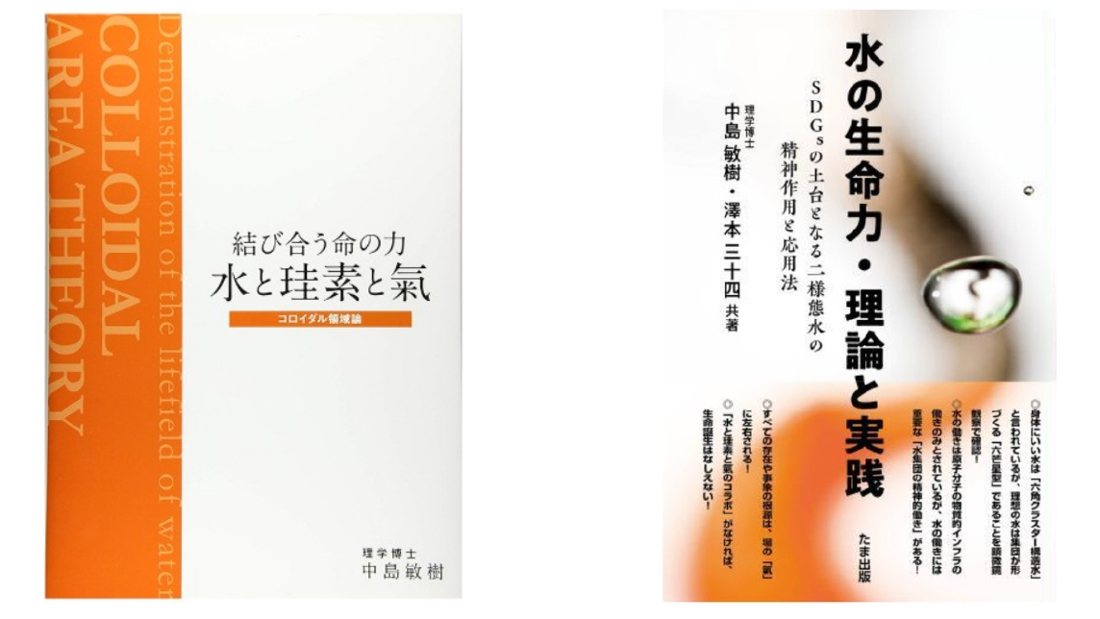
Prof. Toshiki Nakajima, colloid theory: 《結び合う命の力 水と珪素と氣》, 《水の生命力・理論と実踐》.
Proof 1 | UMO is still stable after one year.
UMO SilicaIonised Silica
Fresh production
After 1 year
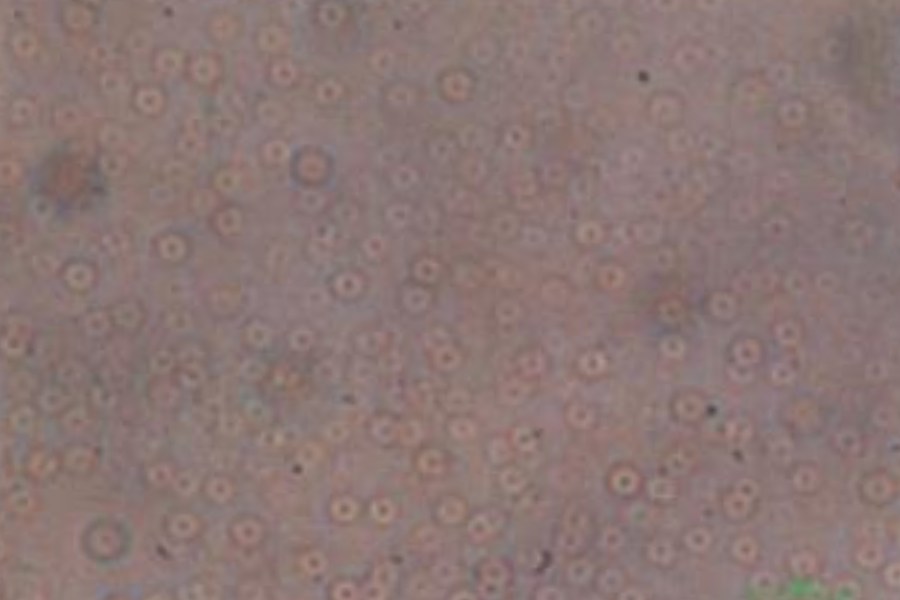
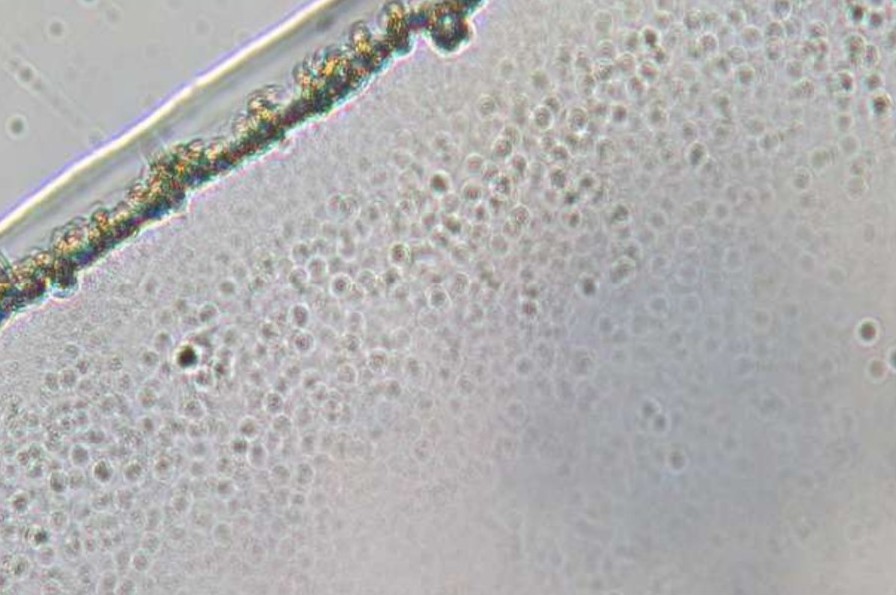
✓ No product degradationUMO Silica and Ionised Silica under the microscope, fresh production vs after 1 year.
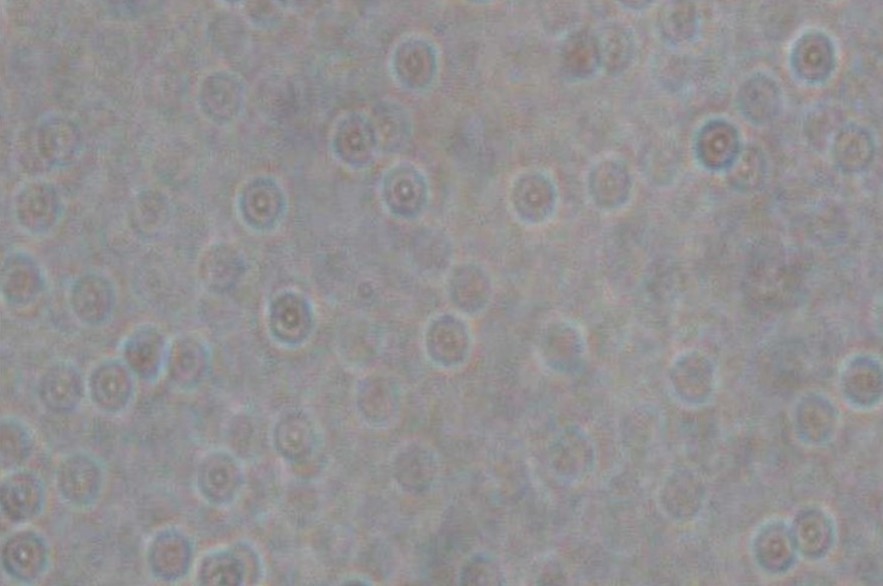
Proof 2 | Even when diluted in water, UMO still keeps its hexagon structure.
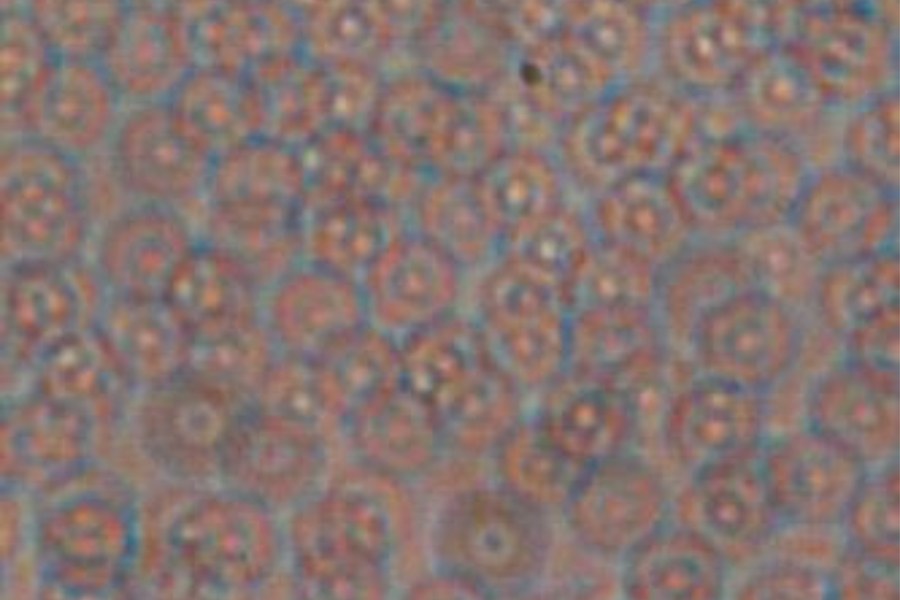
UMO under the microscope, ×400.UMO under the microscope, ×1000.
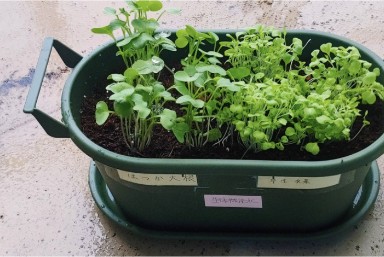
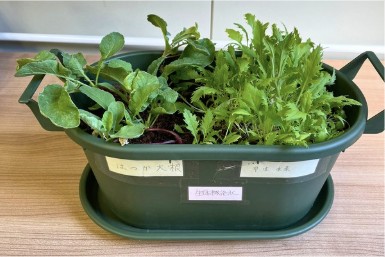
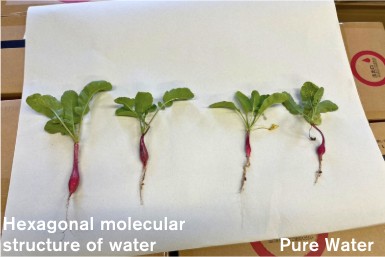
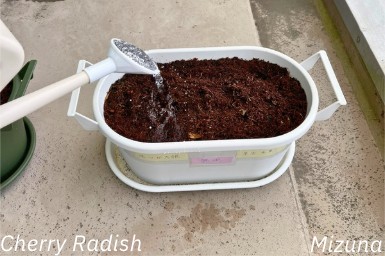
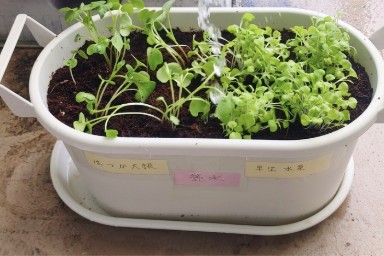
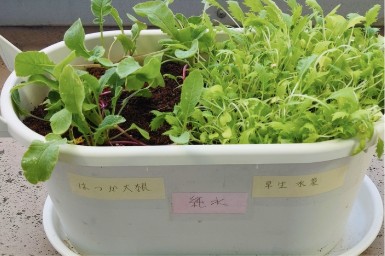
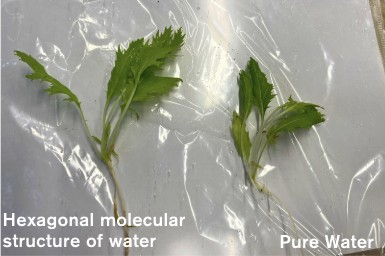
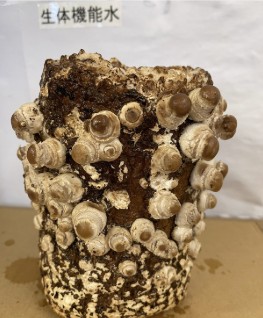
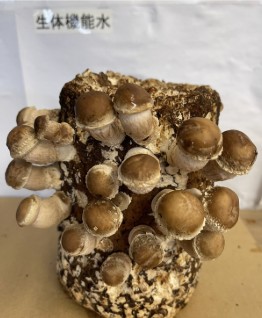
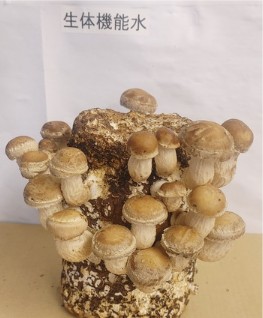
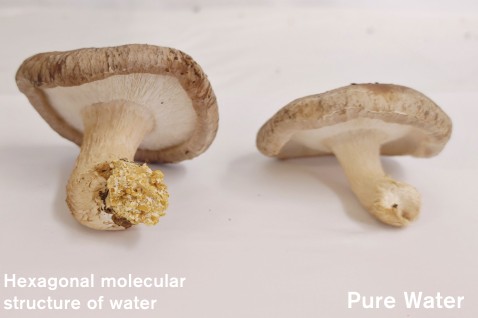
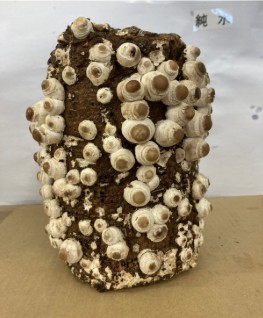
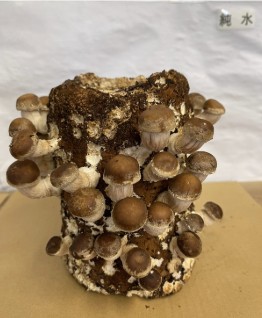
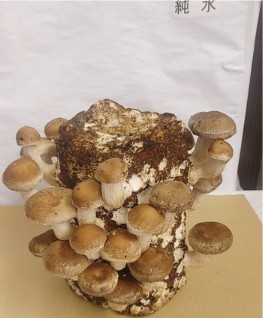
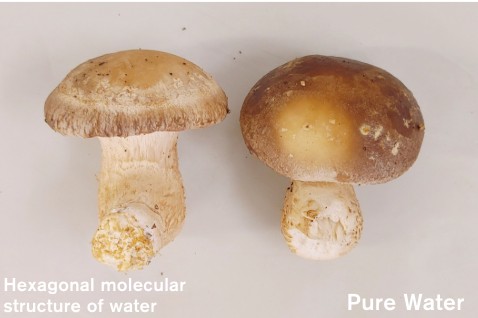
Proof 3 | Hexagonal-structure water (with no silicon mineral added) is also bioactive for plants.
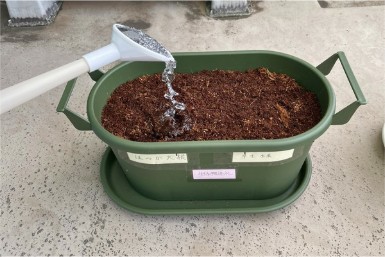
Vegetables: Cherry radish | Mizuna
First day10 days34 daysHarvest
Hexagonal-structure water
Pure water
Mushroom: Shiitake
First day6 days10 daysHarvest
Hexagonal-structure water
Pure water
Nakajima, T. (2019). The Connecting Power of Life: Water, Silicon, and Qi. JP Oversized, 9 Feb 2019. 中島敏樹. 結び合う命の力. 2019年2月9日.
Silicon Is a Beneficial Element Worldwide
ReferenceNot Plant UMO
BasisSilicon = beneficial element for plants
Agencies6 agencies | 6 regions
SourceCompiled by KIWITA from agency websites
Official recognitionSilicon = beneficial element for plants
6 agenciesRecognised in USA, Japan, Korea, EU, Indonesia and the Philippines
Region
Agency
USA
AAPFCO
Japan
MAFF & FAMIC
Korea
RDA & MAFRA
EU
European Commission
Indonesia
Kementerian Pertanian, BRMP Pascapanen
Philippines
Fertilizer and Pesticide Authority (FPA)
Compiled by KIWITA from agency websites
Compiled by KIWITA from the agency websites listed.
Why Silicon Is Seen as a Beneficial Element
ReferenceNot Plant UMO
Studies8 studies | 9 results
MaterialOther silicon materials, not Plant UMO®
Note1 & 9 = same study
Published researchSilicon is seen as a beneficial element for plants →It helps crops under drought and salt stress →Some quality measures improve
This page presents research on the ingredient only.It does not make any claim about a finished product.Results come from the stated test conditions and may not apply to other products or individuals.KIWITA SDN. BHD. is not responsible for how the ingredient is used in any finished product or for any claims made about it.Terms & DisclaimerThe summaries on this page are prepared by KIWITA SDN. BHD. from third-party test reports and published studies. They are for reference only and are not medical, regulatory or professional advice.KIWITA has made reasonable efforts to summarise them accurately. KIWITA does not guarantee that the summaries, figures or translations are complete, current or free from error. If there is any difference, the original report prevails.Test results apply only to the stated samples and conditions. They are not a guarantee of performance, safety, efficacy or fitness for any product, market or use.You are responsible for checking the original reports and for meeting the laws and regulations of your market, including claims, labelling and registration.To the fullest extent permitted by law, KIWITA SDN. BHD. is not liable for any loss or damage arising from reliance on this page. Samples, specifications, quotations and prices are subject to a separate written agreement.
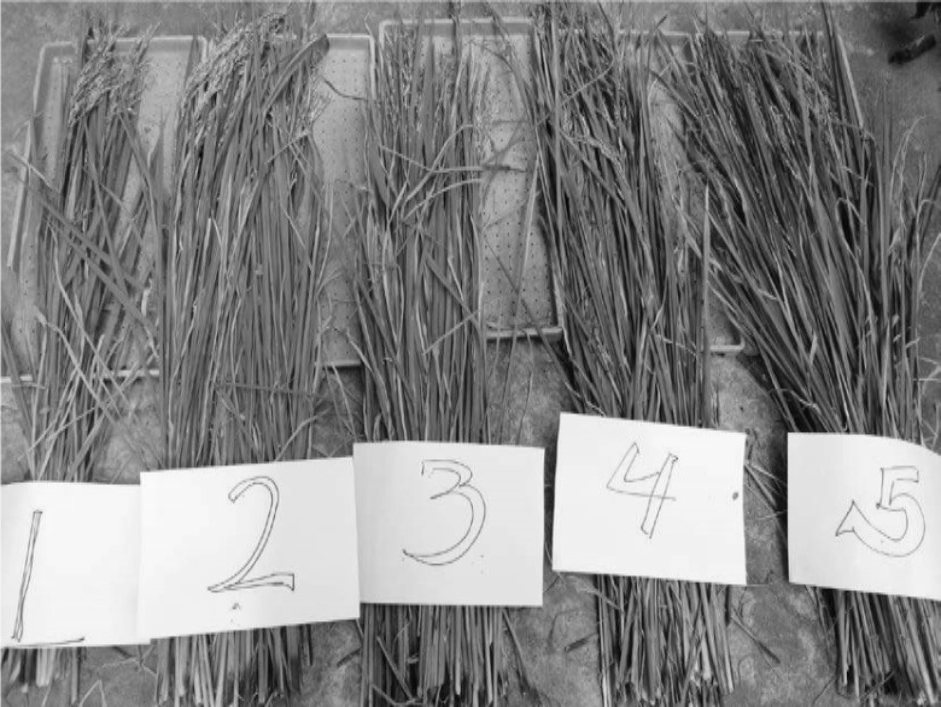 Plots 1–5
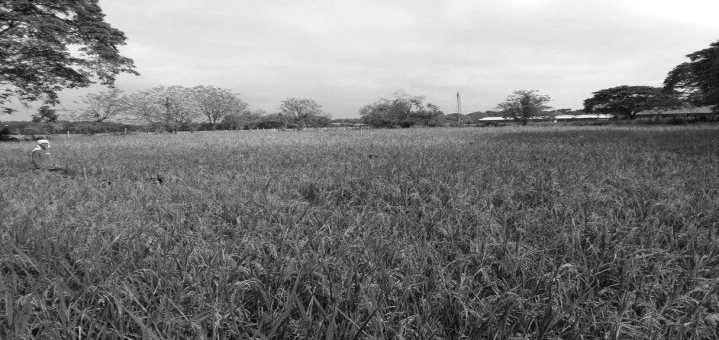 Rice paddy
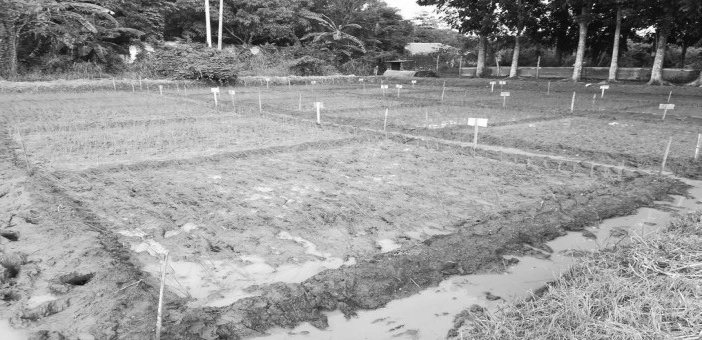 Rice paddy

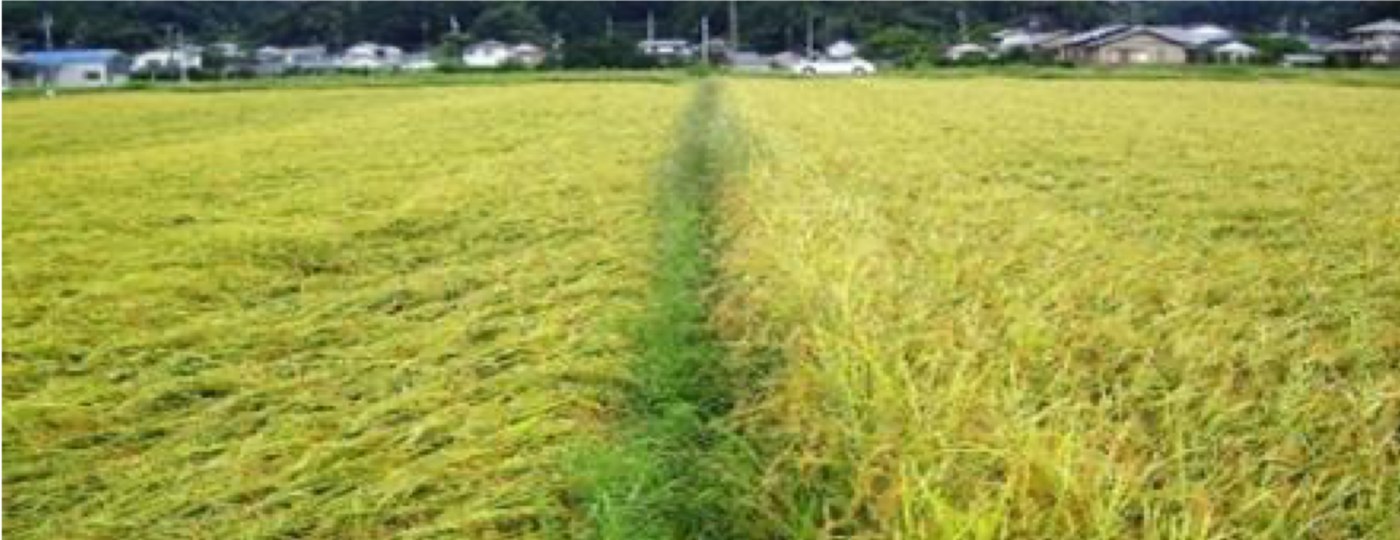 Rice lodging | left control, right silicic acid
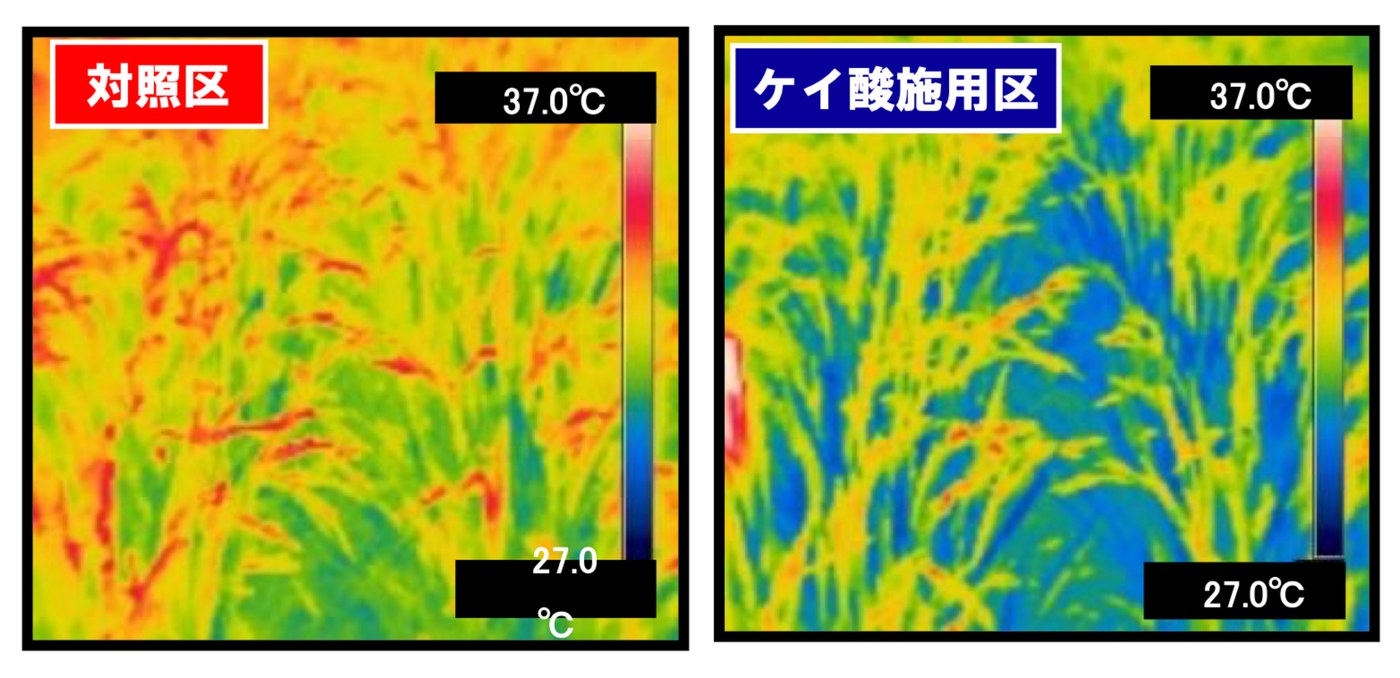 Thermal images | left control, right silicic acid
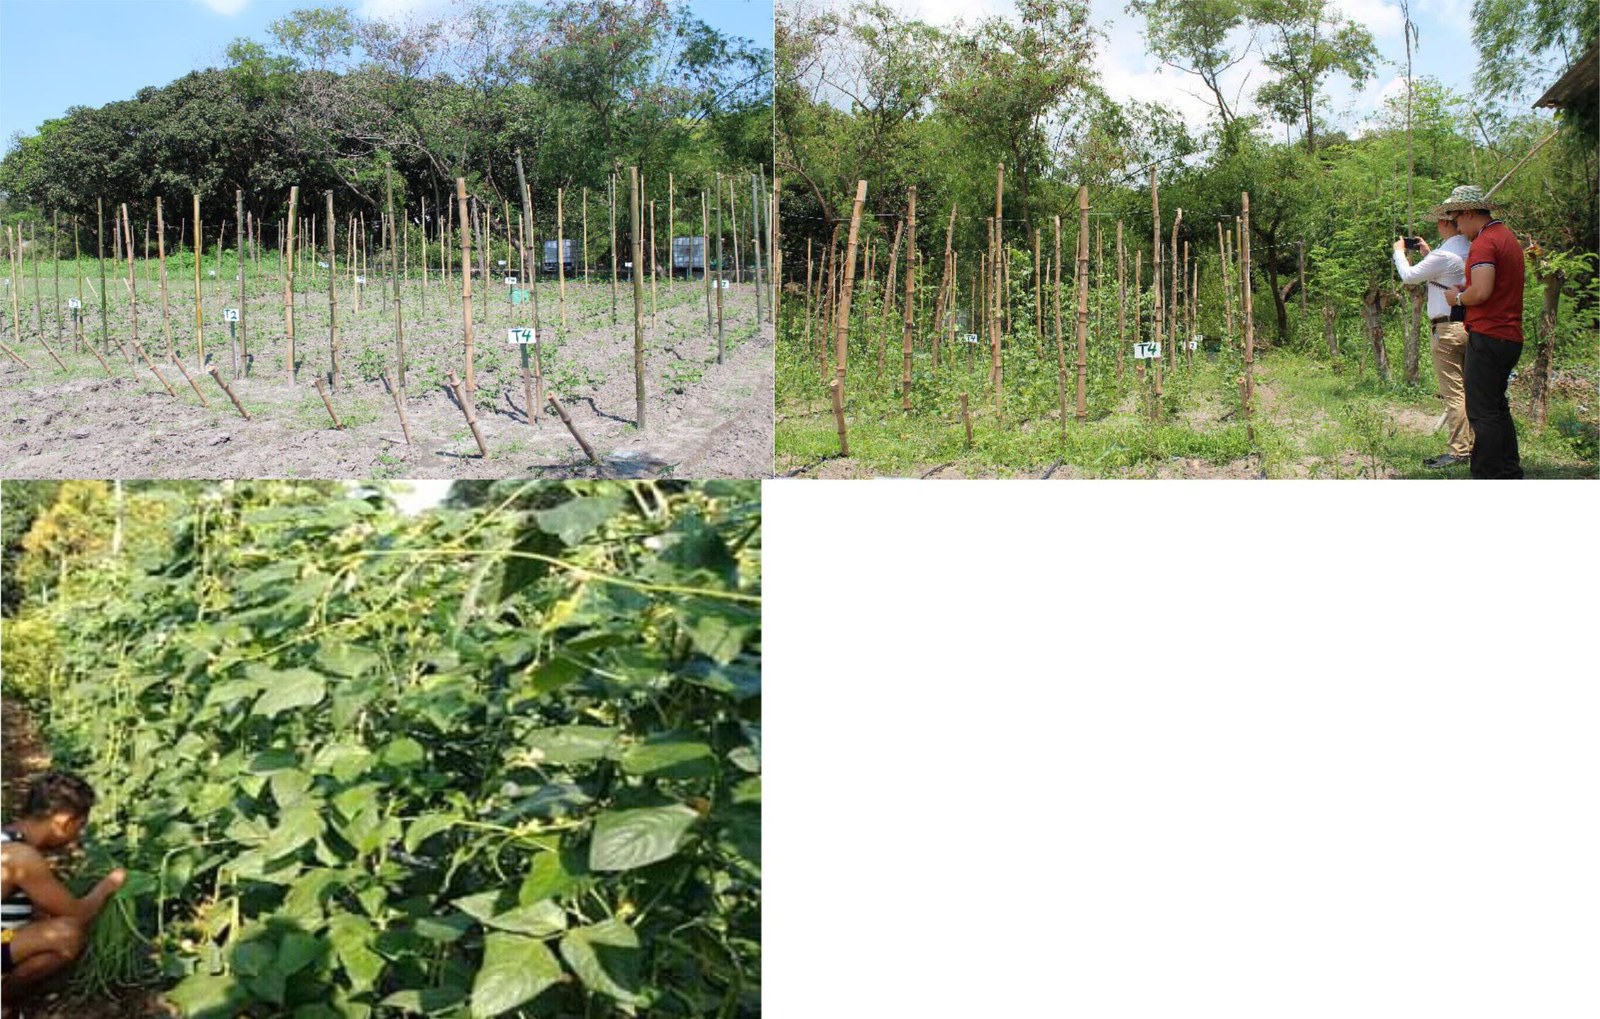 Test area | flowering stage | harvestSquash
 Test area | harvestTomato
 Test area | T1–T5 harvestSweet Sorghum
 Test area | T1–T5 plants at harvest
 Harvest, day 24
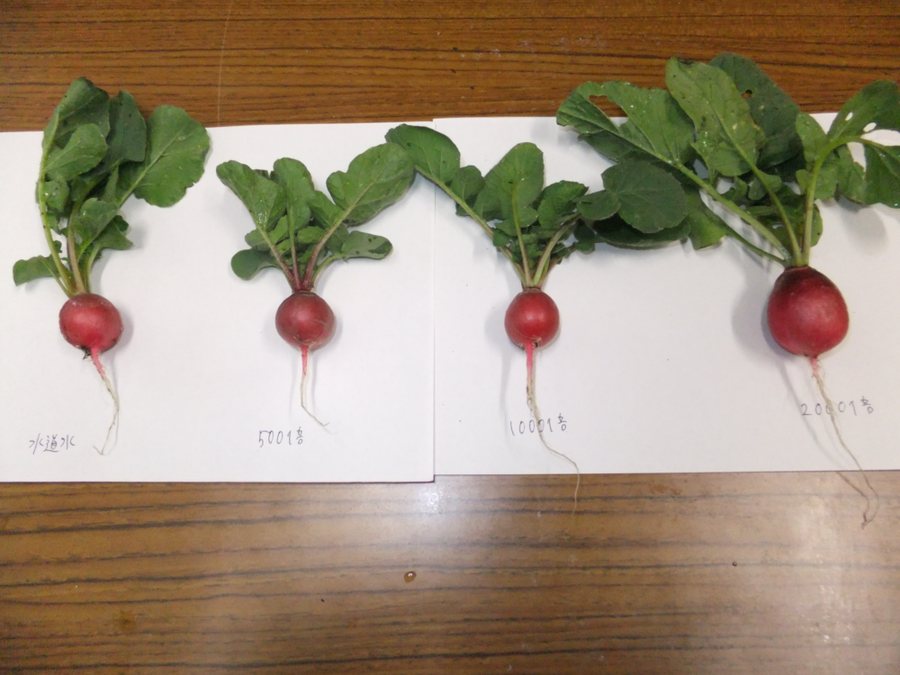 Harvest, day 24
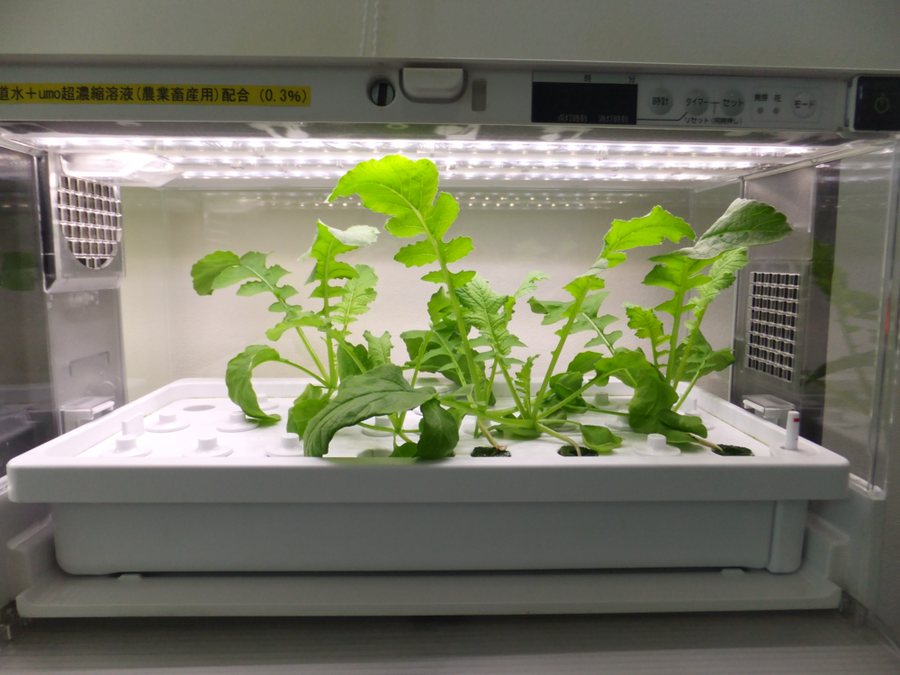 UMO® 1,000× | day 22
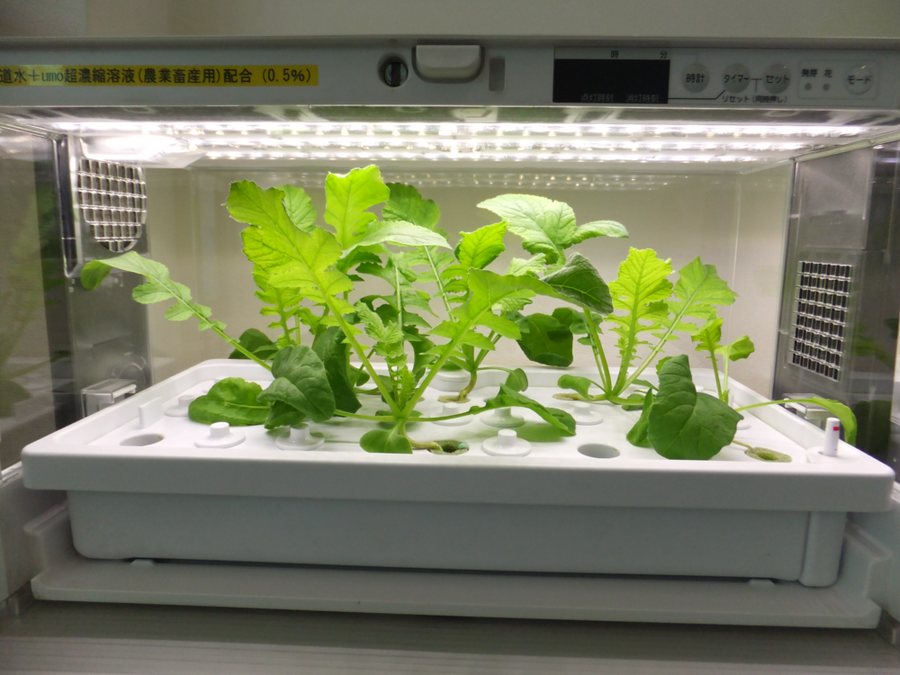 UMO® 600× | day 22
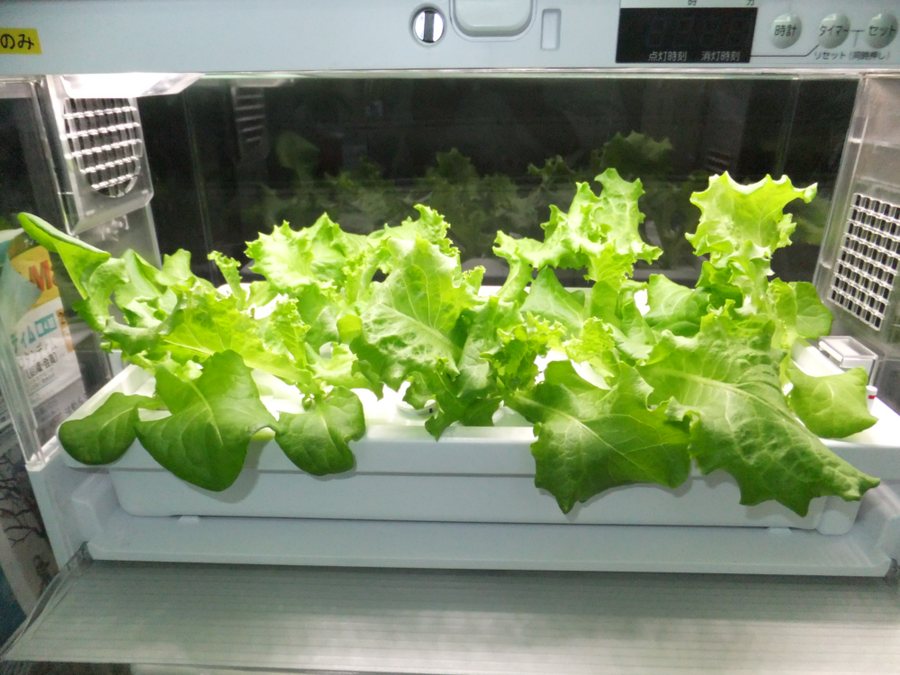 Tap water | day 22
 UMO® 3,000× | day 22
 After harvest
 Control
 UMO® 3,000×
 UMO® 9,000×
 UMO® 15,000×
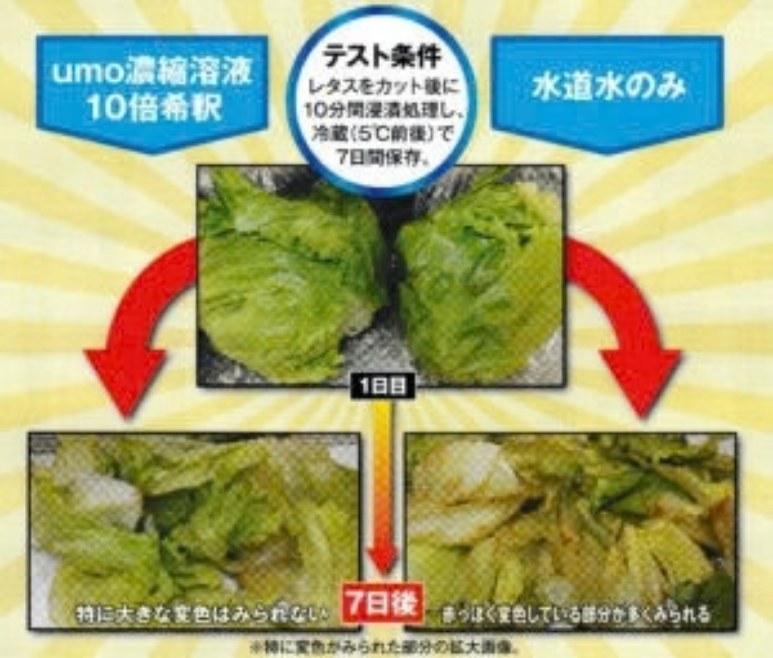 Day 1 → Day 7 | left UMO® 10×, right tap water (original photo)
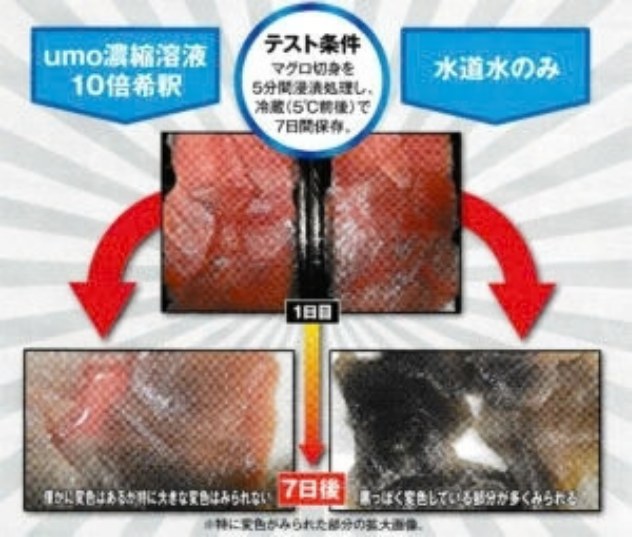 Day 1 → Day 7 | left UMO® 10×, right tap water (original photo)
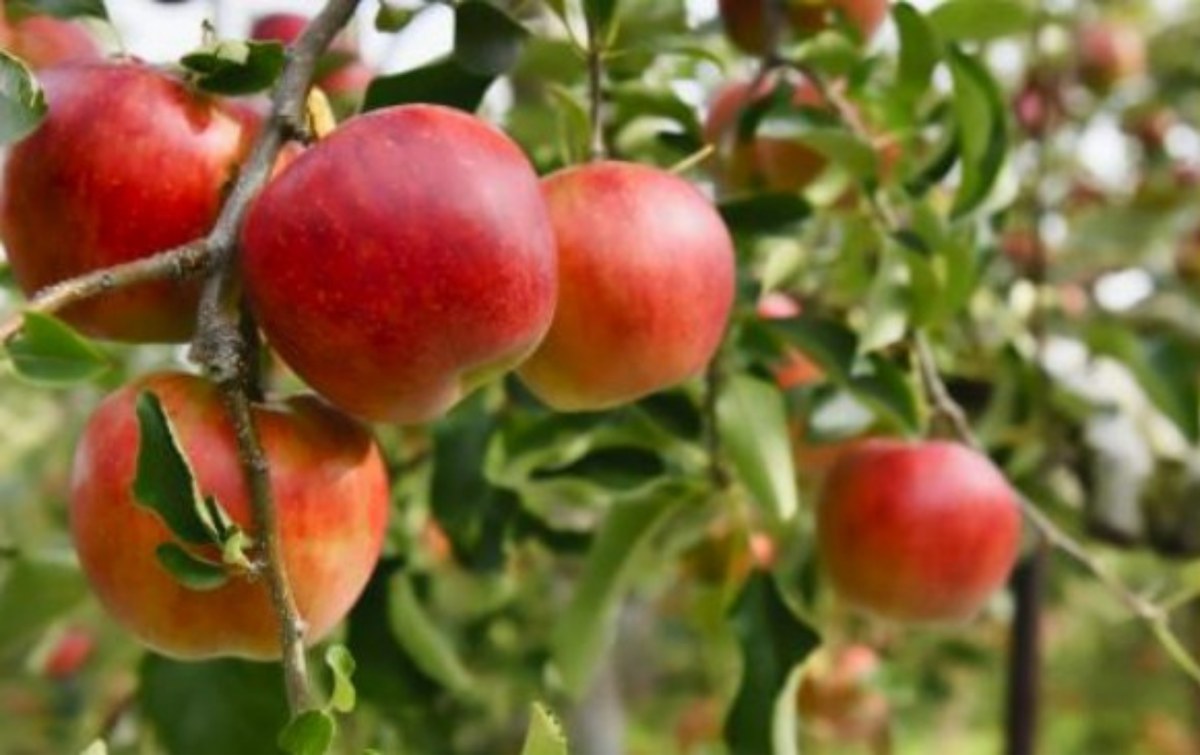 Apple
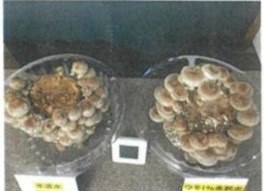 Round 1
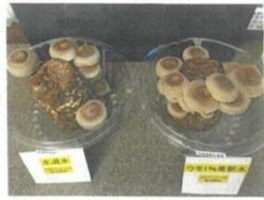 Round 2
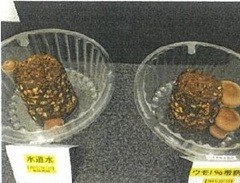 Round 3
 Shiitake
 ① Pure water wash
 ② UMO® 10% wash
 Yuzu
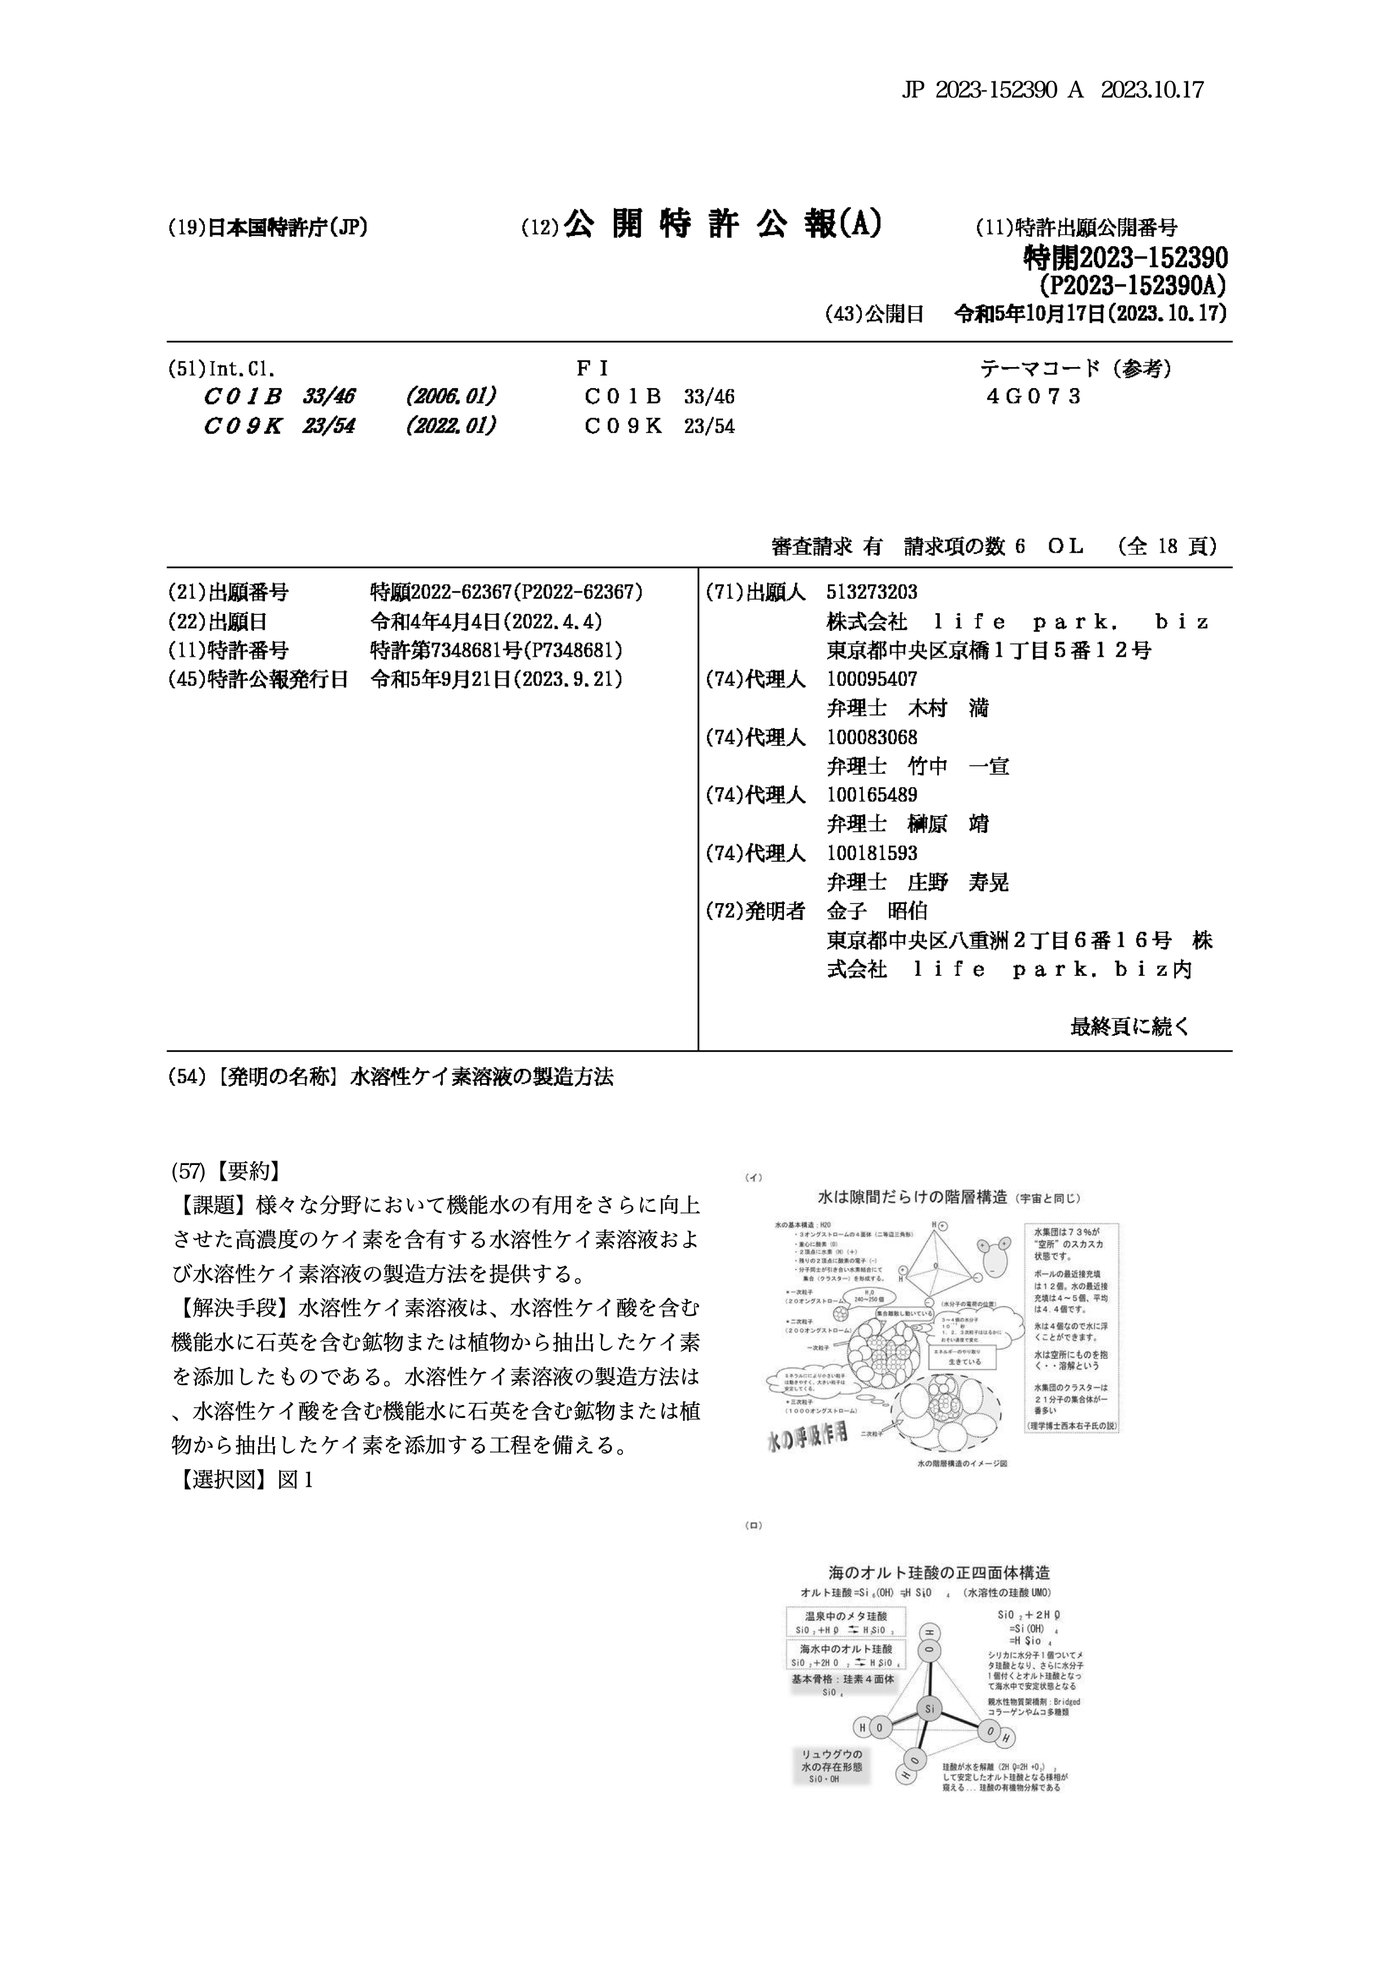 JP 2023-152390 APublished 17 Oct 2023Method for producing water-soluble silicon solution
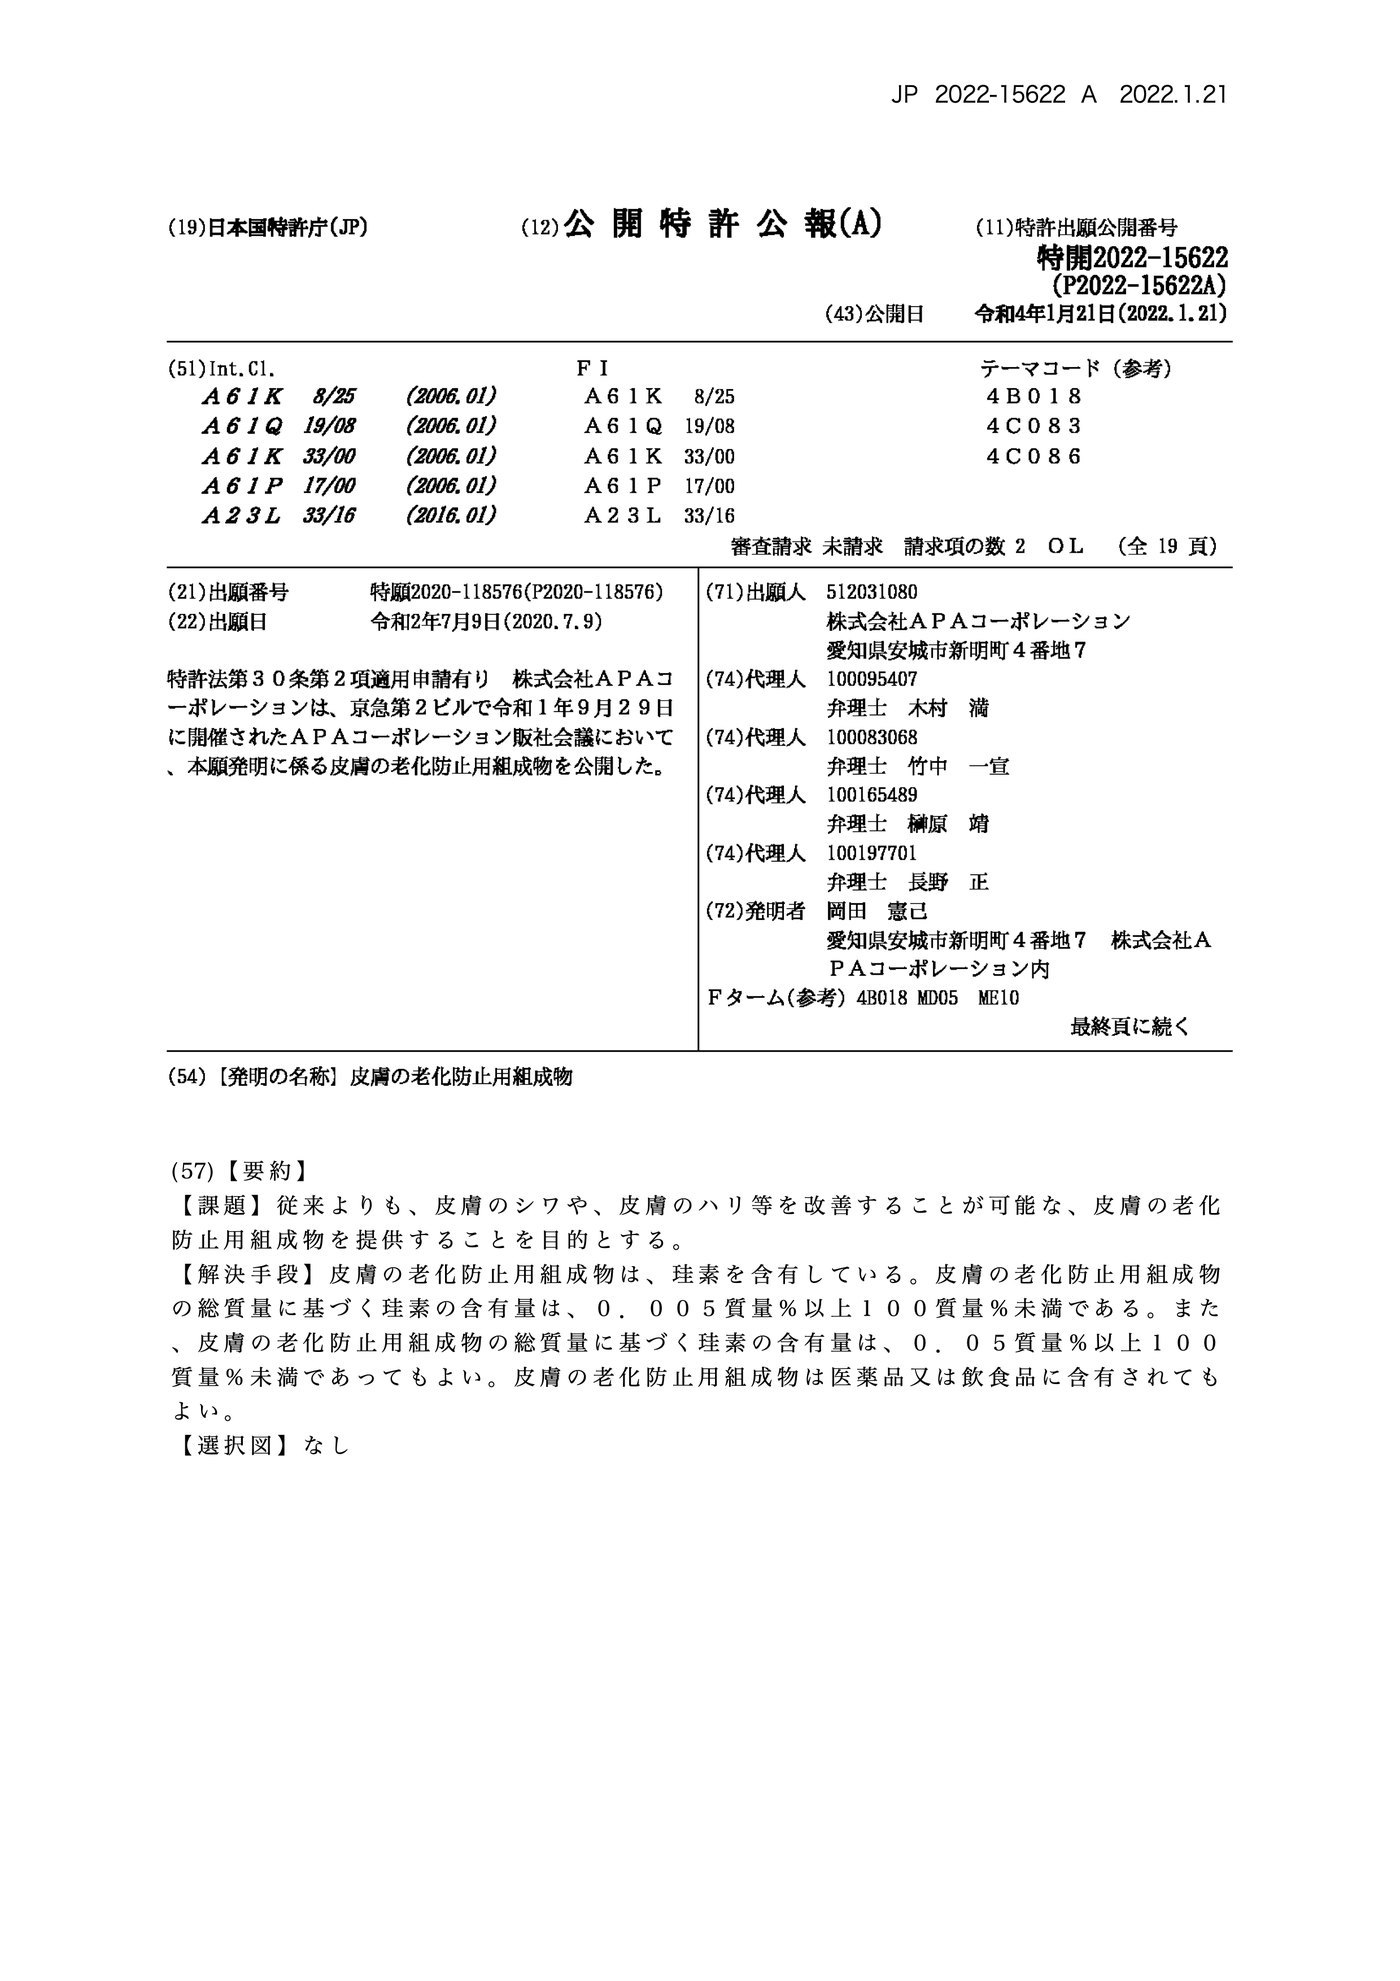 JP 2022-015622 APublished 21 Jan 2022Composition for preventing skin aging
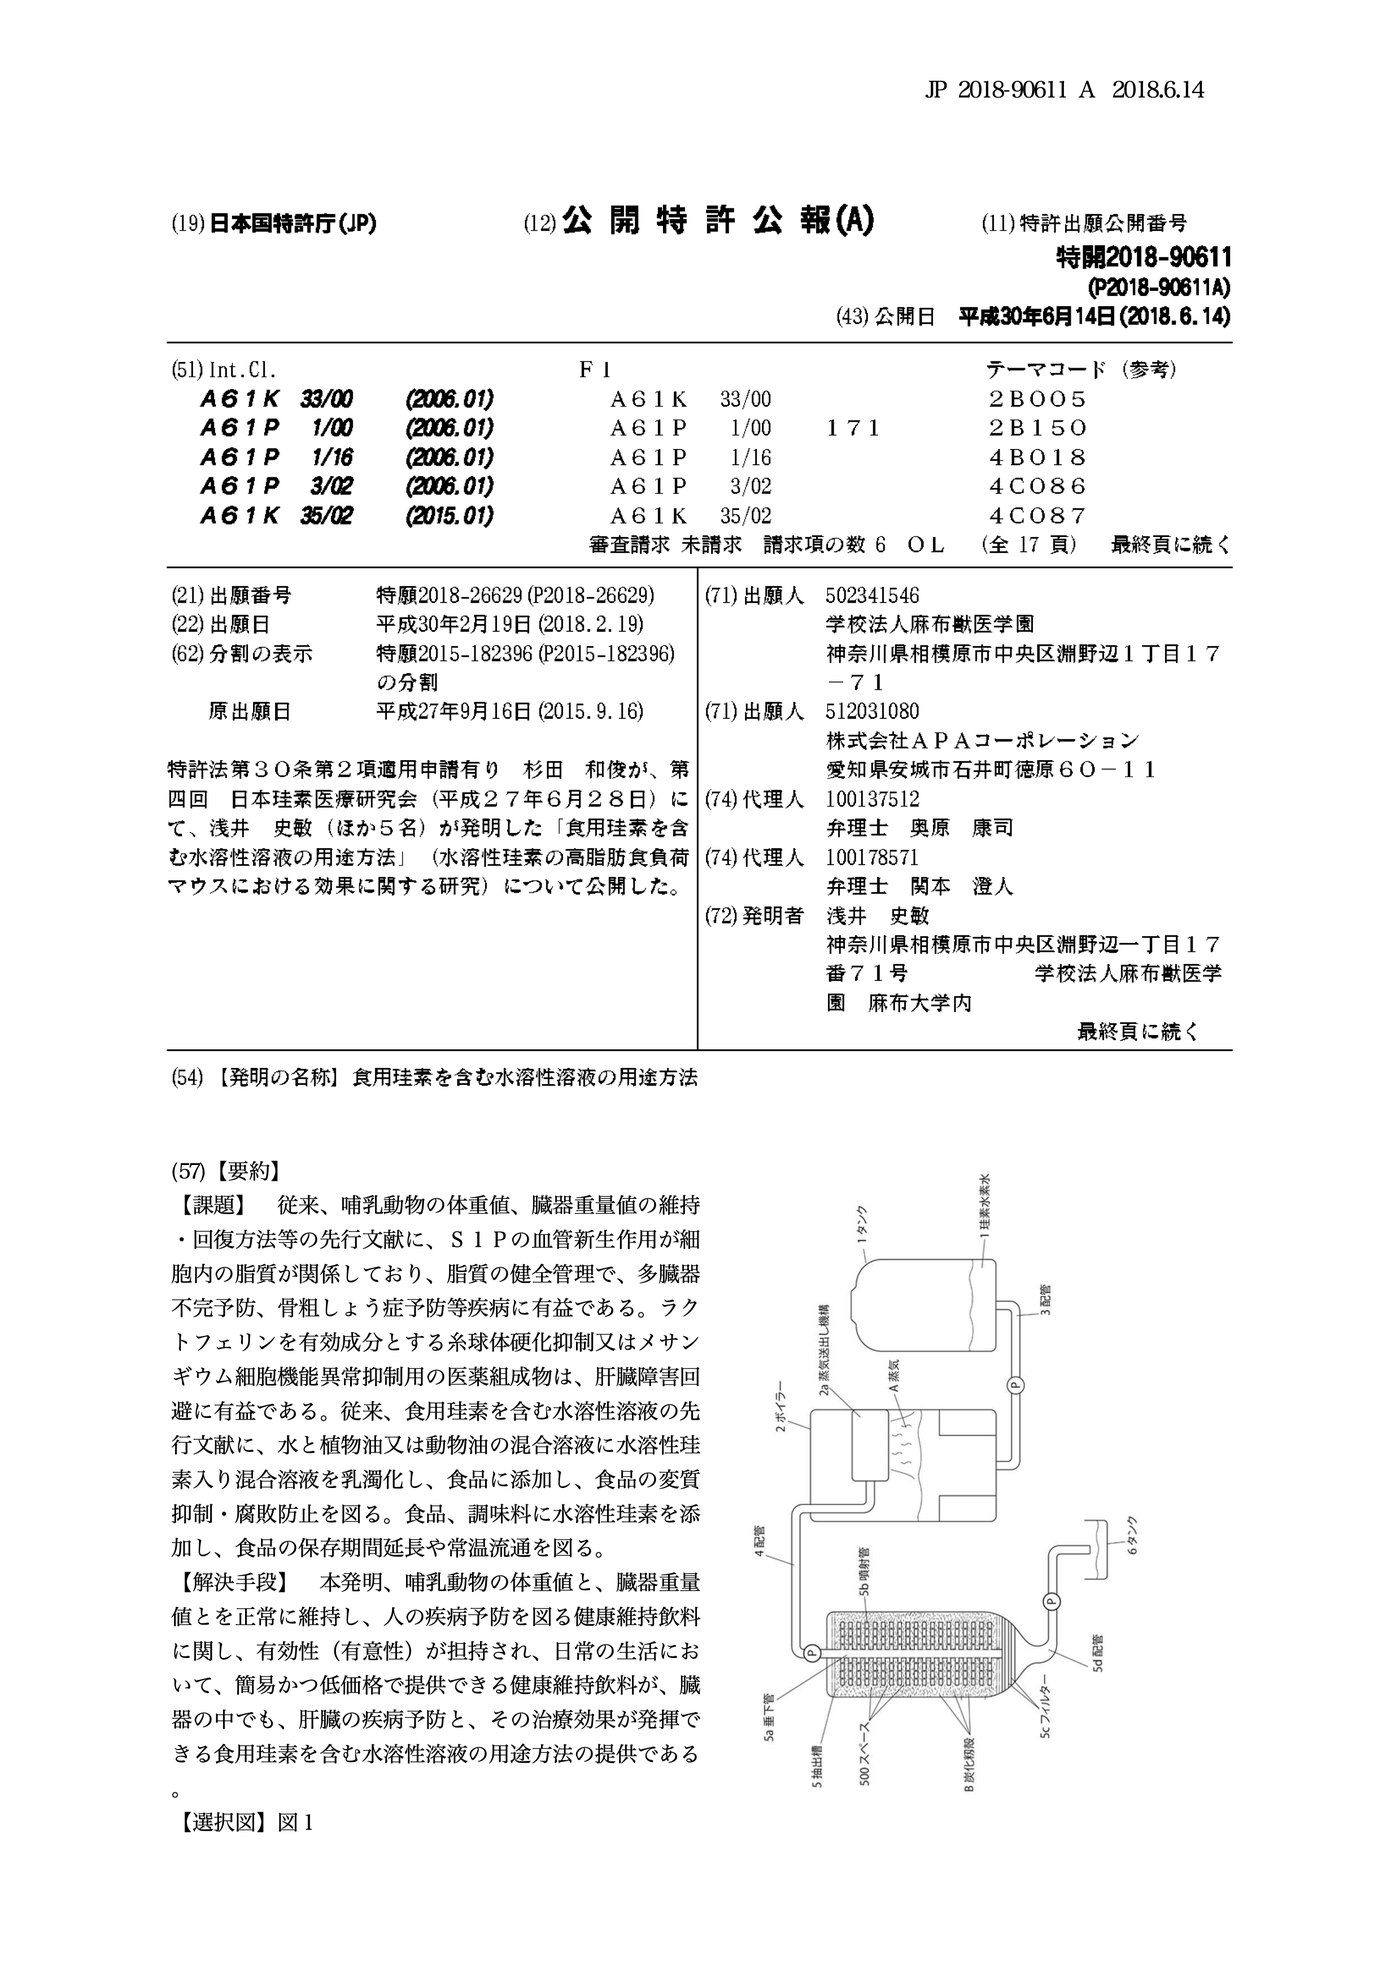 JP 2018-090611 APublished 14 Jun 2018Method of use for a water-soluble solution containing edible silicon
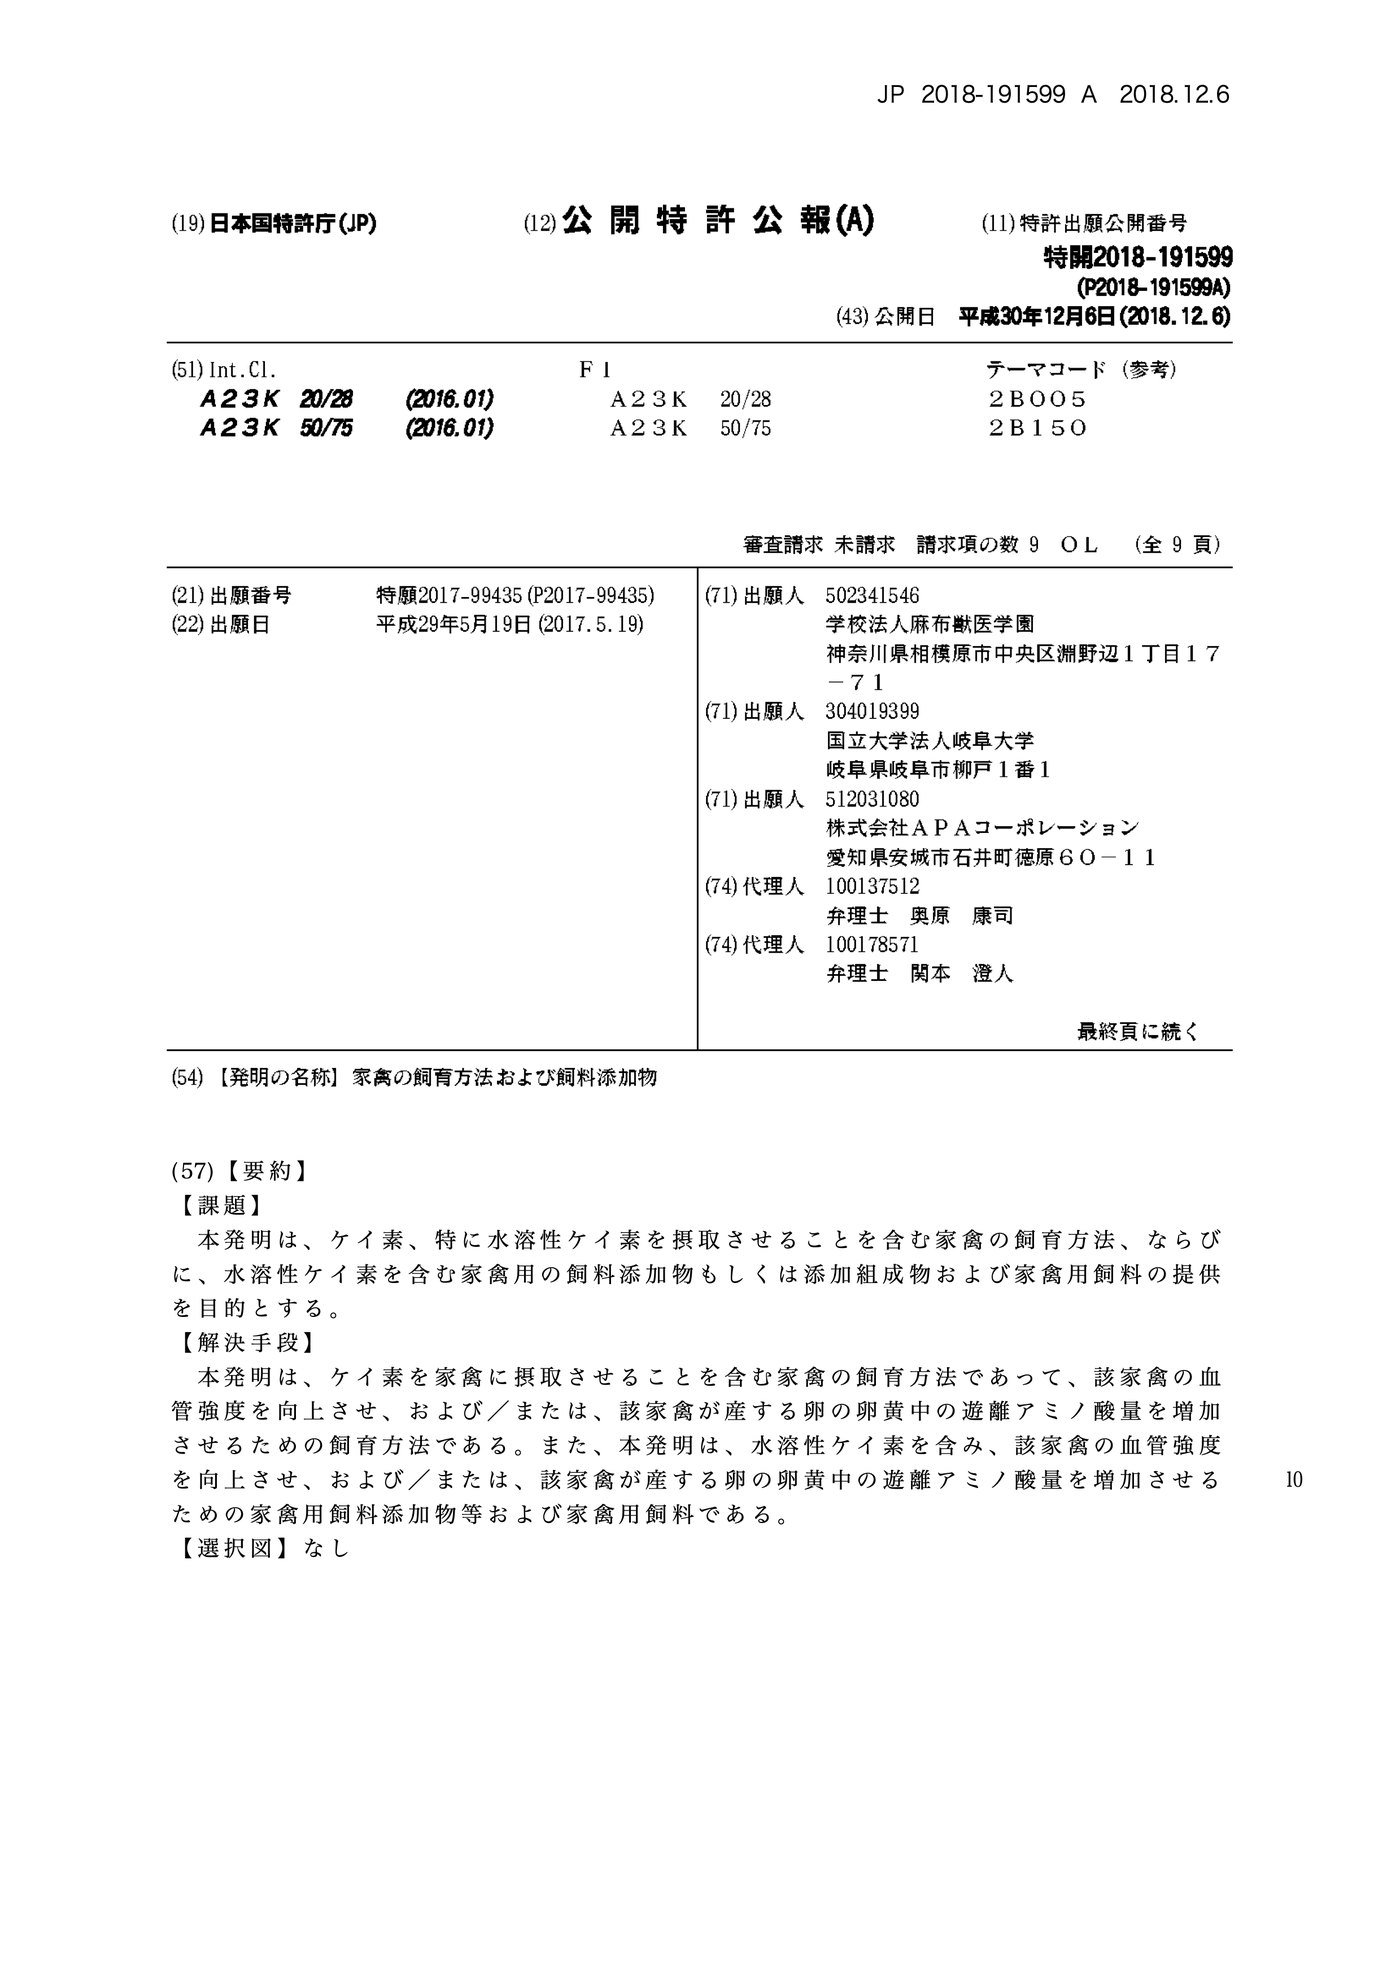 JP 2018-191599 APublished 6 Dec 2018Method for raising livestock and feed additive
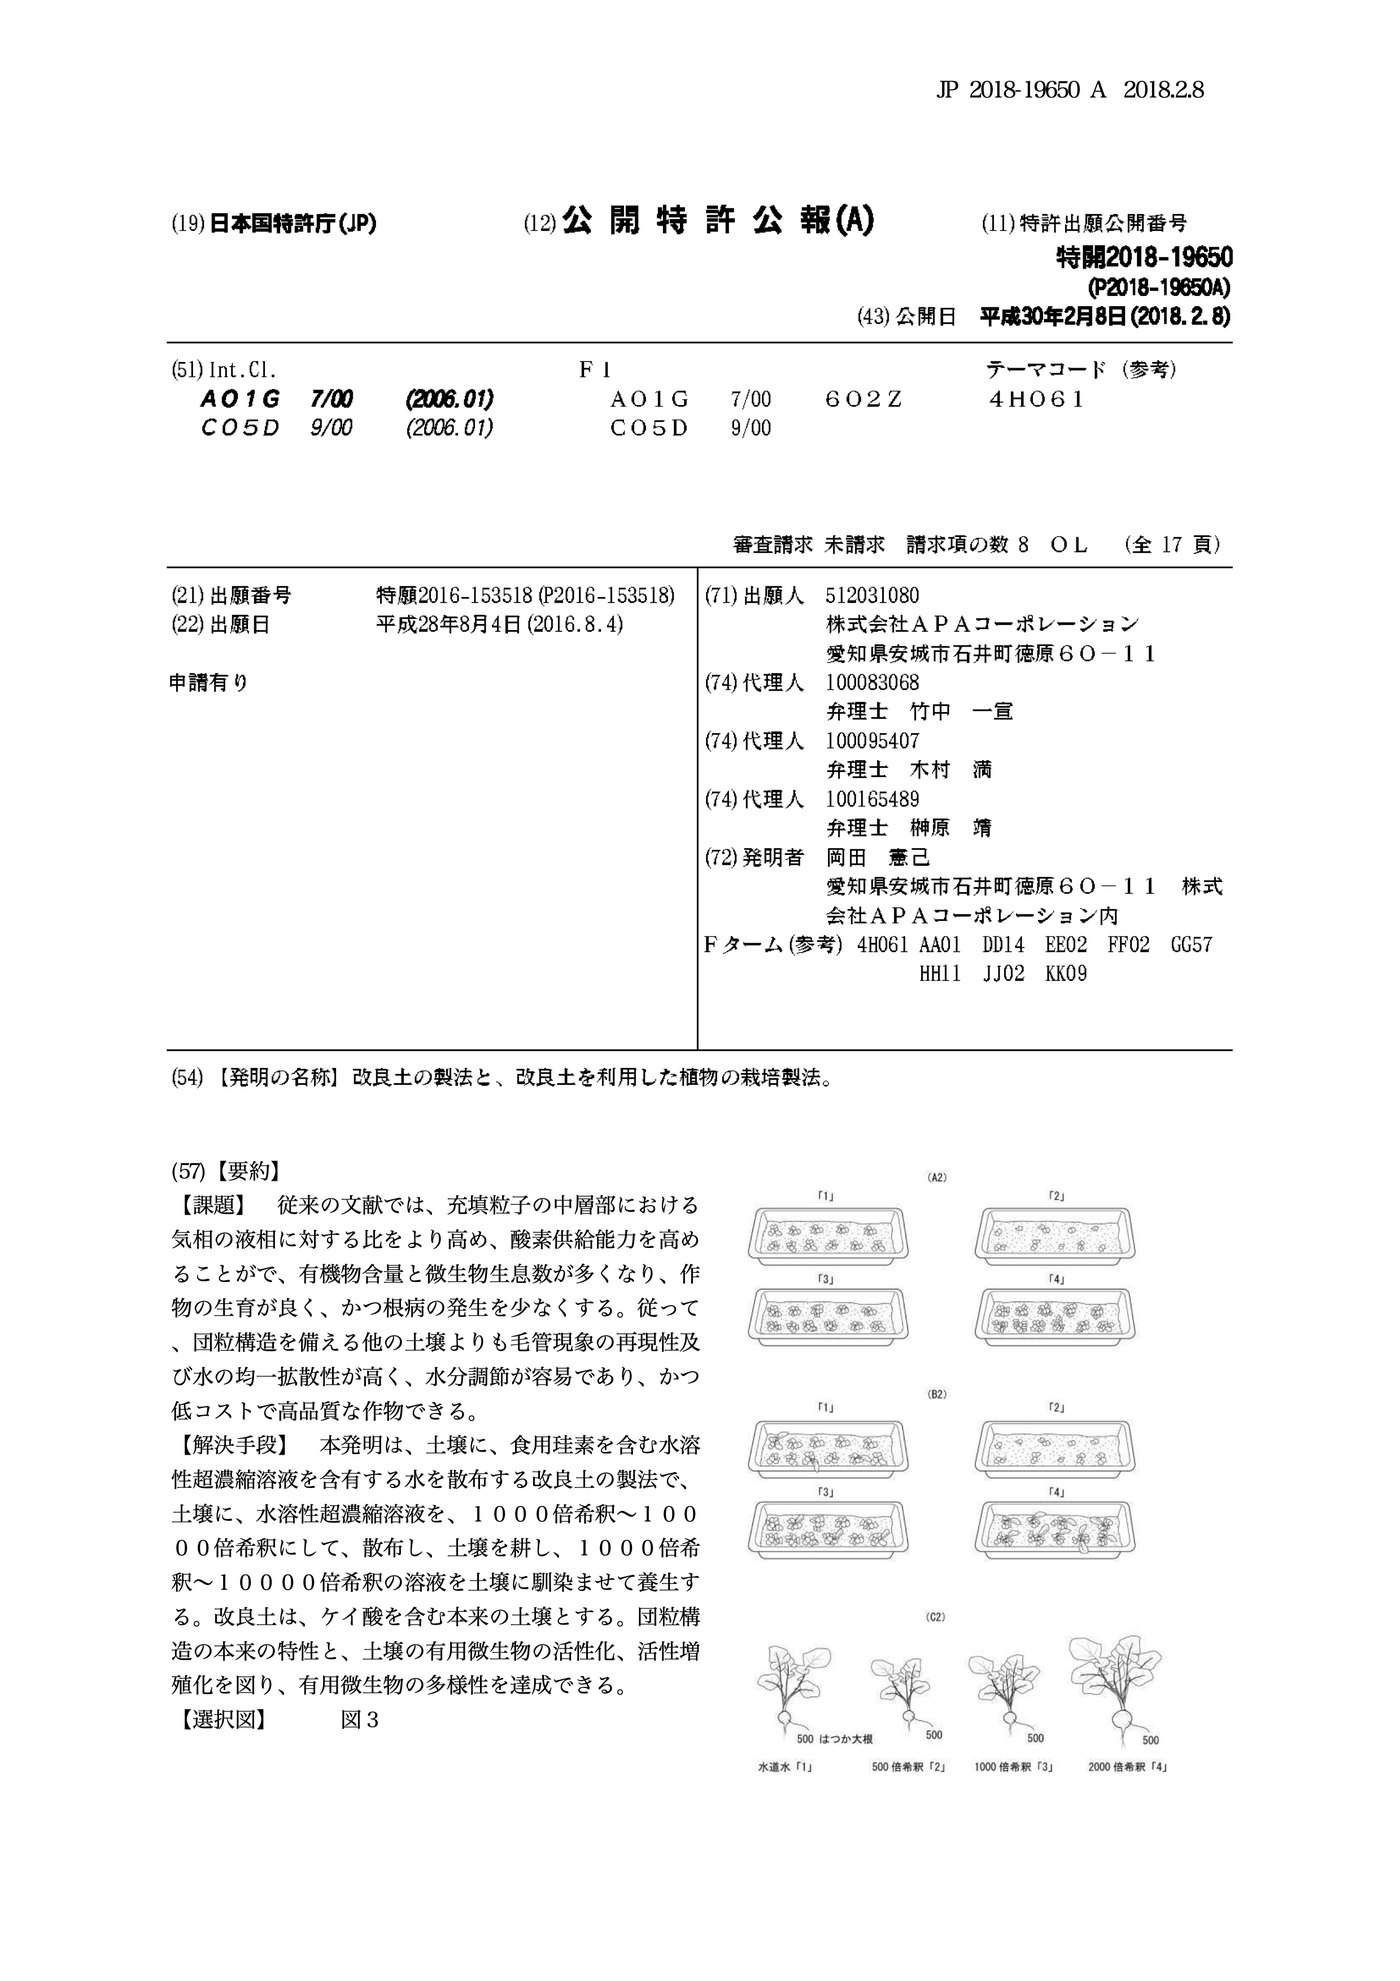 JP 2018-19650 APublished 8 Feb 2018Method for producing improved soil and method for cultivating plants using improved soil