← Back to Evidence
For New Product Development and R&D reference only. Not intended for consumers.
Crystal UMO® for Health
Human, animal and pet tests for liver, blood pressure, bone and vessels, immunity and odor.
Core Results
Control = 100Fatty Liver & Weight
6 results | Human ×6Blood Pressure & Stress
3 results | Human ×3Bone & Vessels
4 results | Human ×1 | Animal ×2 | Reference ×1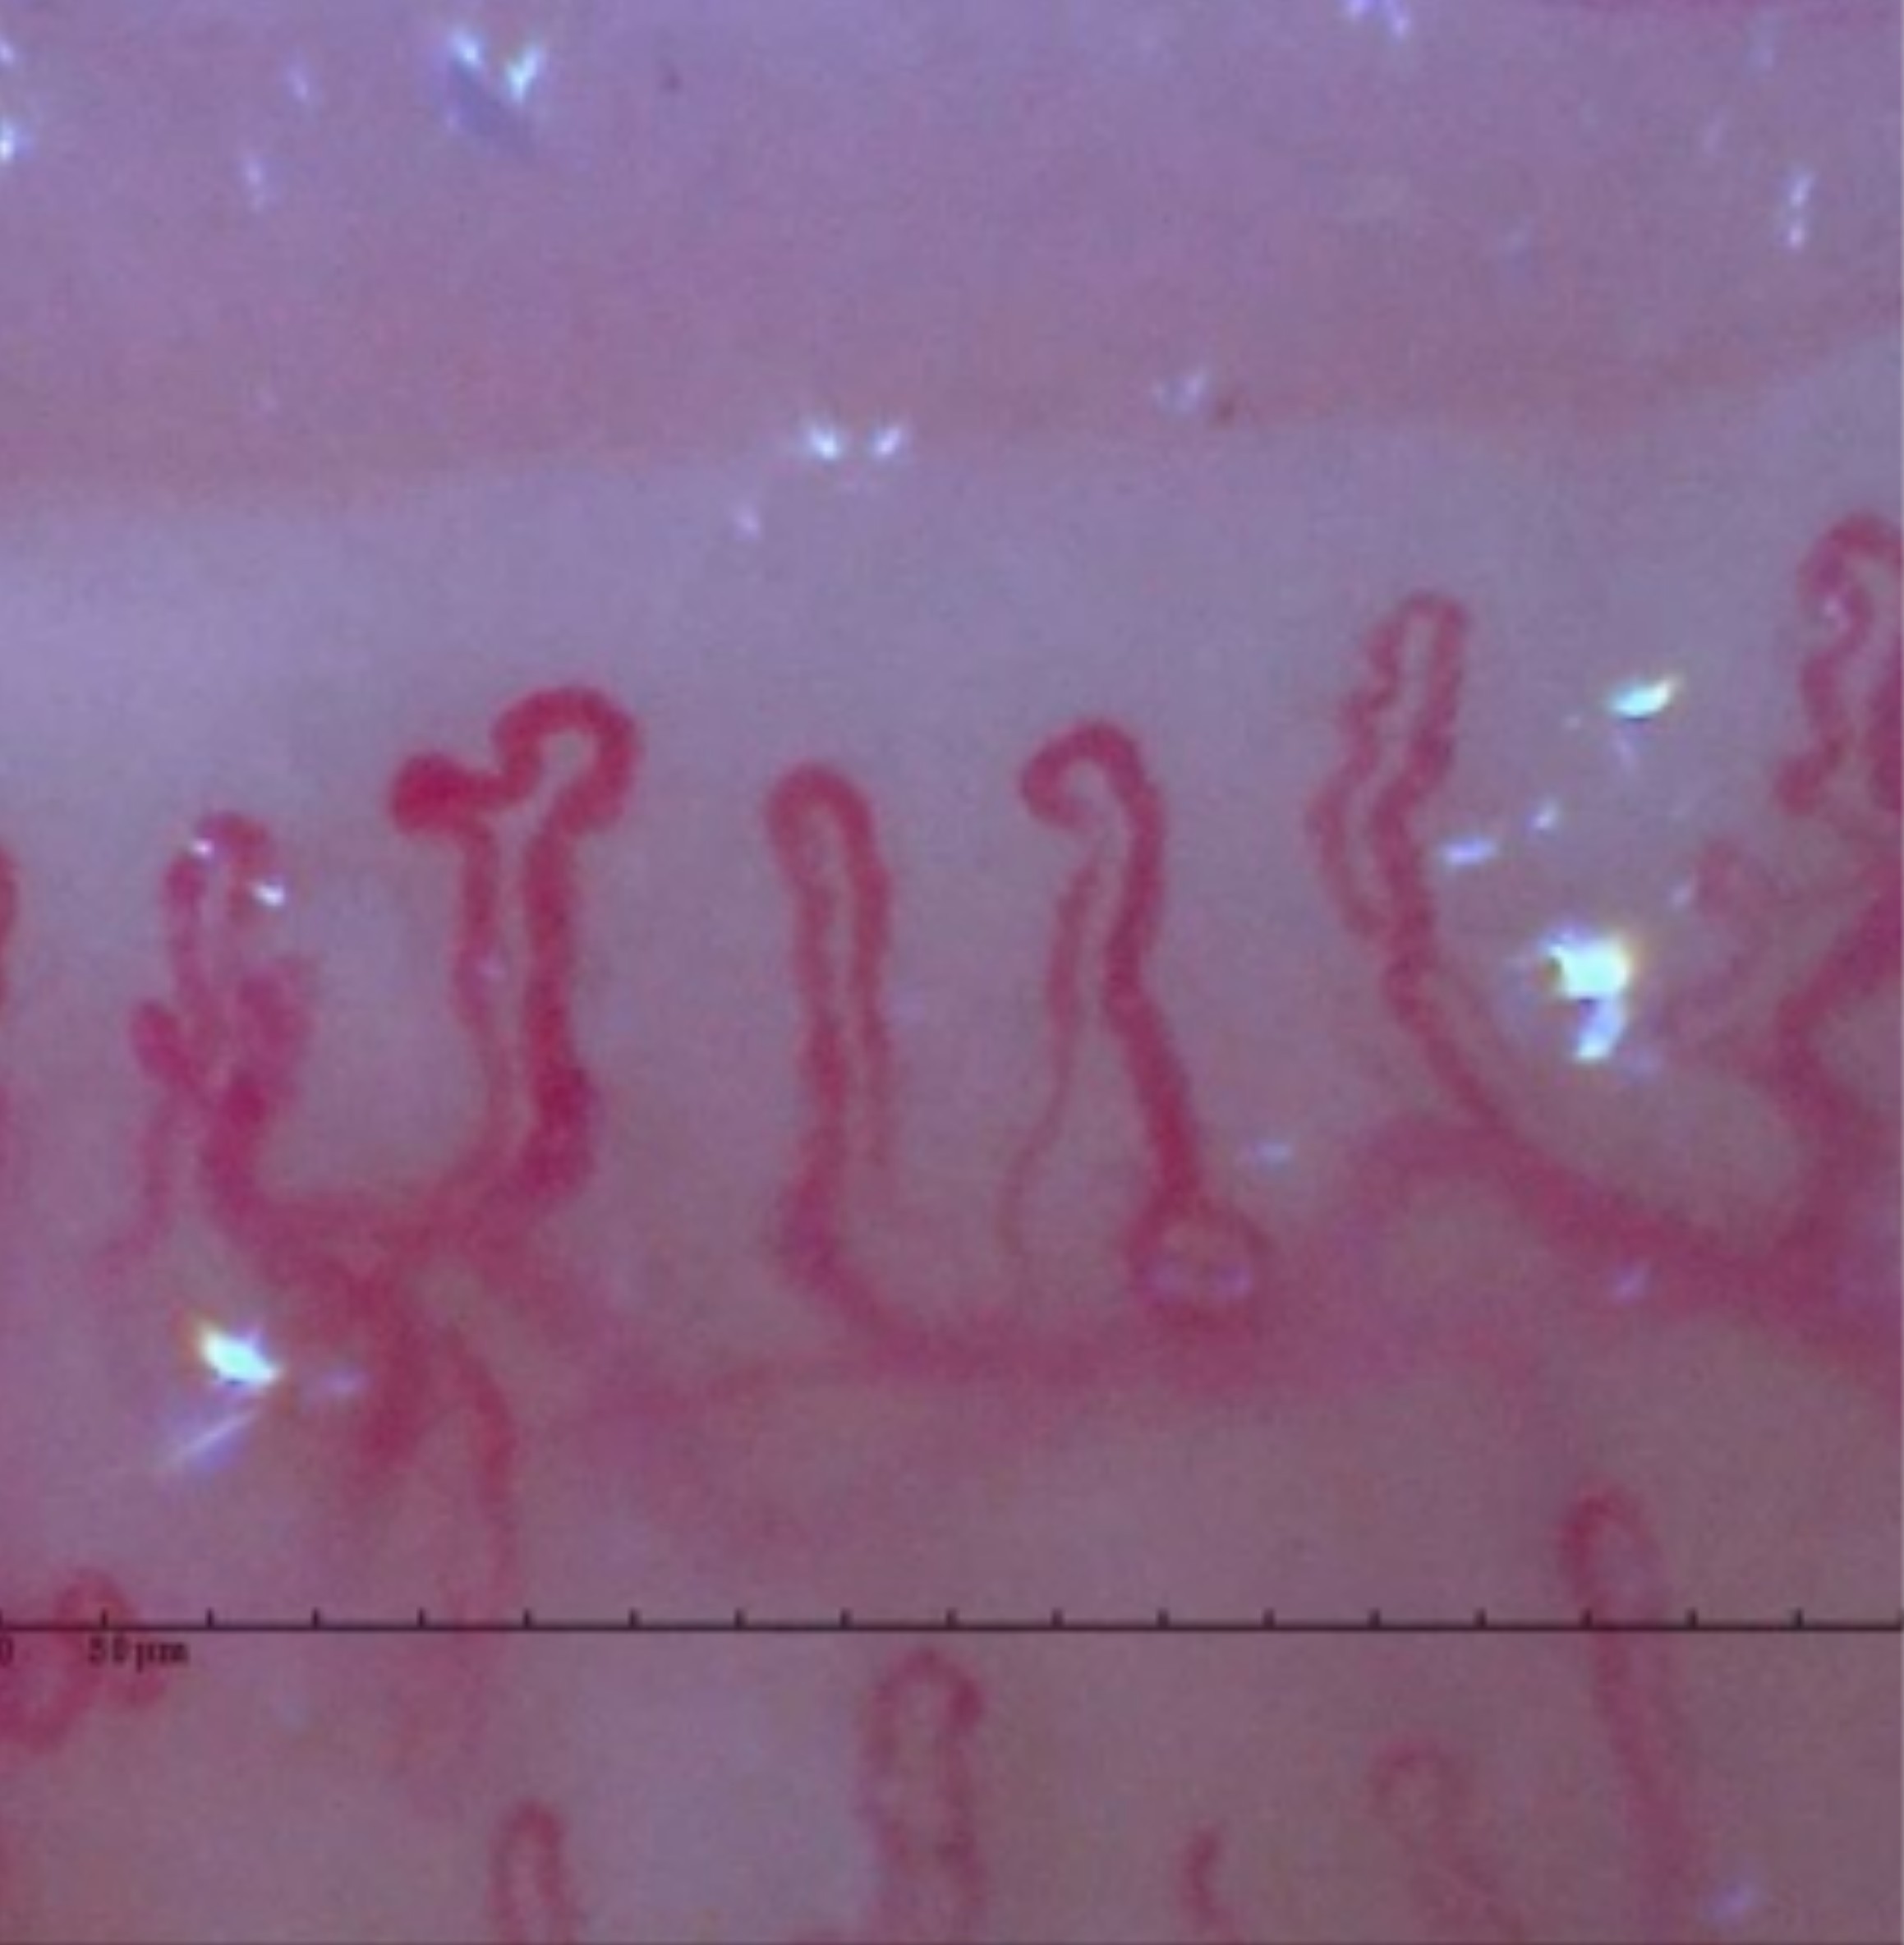
Immunity
4 results | Animal ×4Heavy Metal Detox
2 results | Human ×2Kidney & Blood Fats
7 results | Animal ×7Antioxidant
3 results | In vitro ×3Odor Control
5 results | Pet ×2 | Animal ×3What We Tested
Fatty Liver: Human Clinical Trial↓Blood Pressure and Stress: Human Pilot Study↓Customer Testimonial: Capillary Blood Flow↓Silicon and Collagen↓Framingham Offspring Study↓Silicon: The Cross-Linker of Bone and Skin↓Rat Bone Strength and Vessel Elasticity↓Immune Function in Rats↓Nail Minerals and Heavy Metals: Observation Test (n = 1)↓Kidney Function and Safety↓Antioxidant: Free Radical Scavenging↓Gut Health: Broiler Fecal Odor↓Pet: Bad Breath in Dogs↓Fecal Odor in Mice↓
Evidence Highlight
Fatty Liver: Human Clinical Trial
HumanSubjects40 patients with non-alcoholic fatty liver disease (NAFLD)
HospitalAichi Medical University Hospital
DesignRandomized | placebo | two groups
DoseUMO® Silica 9 mL daily (about 40 mg of silicon) | control: none
LifestyleBoth groups kept regular diet and exercise
Check pointsBefore | 3 months | 6 months
Body measurements
Blood chemistry
Body measurements
Blood chemistry
UMO® n = 16 | control n = 9 | one small trial
Terms
Lifestyle diseasesObesity, high blood pressure, diabetes, high blood fats.
Randomized controlled trialSubjects randomly split into two groups; one of the most reliable human study types.
Add-on effectThe extra improvement from UMO® on top of diet and exercise.
| Item | Control | UMO® | p (UMO®) |
|---|---|---|---|
| Body weight | n.s. | ↓ sig. 3 & 6 mo (≈ 3 kg) | 0.0340 (3 mo), 0.0091 (6 mo) |
| BMI | n.s. | ↓ sig. 3 & 6 mo | 0.0444, 0.0024 |
| Waist | n.s. | ↓ sig. 6 mo (3 cm) | 0.0021 |
| Visceral fat area | ↑ n.s. | ↓ n.s. | — |
| PAI-1 | n.s. | ↓ sig. 6 mo (10 ng/mL) | 0.0425 |
| Adiponectin | ↓ sig. 3 mo | No change | 0.0295 (control drop) |
| ChE | n.s. | sig. 6 mo (↓ 35 U/L) | 0.0472 |
| AST | n.s. | trend 6 mo (↓ 15 U/L) | 0.059 |
| Blood fats, sugar, ALT, γ-GTP | n.s. | n.s. | — |
| QOL (SF-8) | n.s. | n.s. | — |
| Side effects | None | None | — |
sig. = p < 0.05 | n.s. = not significant | 40 randomized → 25 analysed
Lifestyle disease + fatty liver | RCT | UMO® ≈ 9 mL/day + diet & exercise | UMO® n = 16 | control n = 9 | 6 months

Fukuzawa, Y., Okada, K., & Jimbo, D. (2022).Usefulness of Water Soluble Silicon for Fatty Liver Combined with Lifestyle Related Disease. Aichi Medical University Hospital.
Full paper: Fatty Liver Trial →Blood Pressure and Stress: Human Pilot Study
HumanSubjects12 people with pre-hypertension
average age 41.08 ± 1.73 years
average age 41.08 ± 1.73 years
DesignPilot study | no control group
DoseUMO® water-soluble silica 9 mL daily (40 mg silicon)
Duration6 weeks
SourceShinbo, T. (January 2024)
No adverse events
Terms
Accelerated plethysmographyA fingertip device records the pulse wave to show autonomic nerve state.
Autonomic nervesAutomatic control of heart rate, blood pressure and digestion; sympathetic (alert) and parasympathetic (relax).
Salivary cortisol / sIgAA stress hormone and an immunity-linked antibody, from saliva.
eGFRKidney filtering ability.
Wilcoxon signed-rank testCompares the same people before and after; p < 0.05 = significant.
Felt after drinking% of subjects
More energetic
≈ 58.3%
Better blood pressure
≈ 50.0%
Better motivation & focus
≈ 41.7%
Wake up refreshed
≈ 33.3%
Less shoulder stiffness
≈ 33.3%
Less cold hands & feet
≈ 25.0%
Less fatigue
≈ 16.7%
Better skin
≈ 16.7%
Weight loss
≈ 8.3%
Less swelling
≈ 8.3%
0%10%20%30%40%50%60%70%
Subjective | ≈ = read from chart | n = 12
| Before → after 6 weeks | Result |
|---|---|
| Systolic | ↓ sig. | ≈ 129.3 → ≈ 118.9 |
| Diastolic | ↓ sig. | ≈ 81.6 → ≈ 75.7 |
| Holmes stress, Holmes total | ↓ sig. | ≈ 49.0 → ≈ 12.4 | ≈ 71.7 → ≈ 36.1 |
| Fatigue VAS, OSA sleep | n.s. |
| SDNN (autonomic) | ↓ sig. | ≈ 53.7 → ≈ 40.6 |
| PSI (physical stress) | ↑ sig. (more physical tiredness) |
| Blood tests | Small sig. changes, within normal range |
| Adverse events, dropouts | 0 | 0 |
≈ = read from chart | sig. = P < 0.05 | ethics No. 20230915-1
Healthy adults 20–64 (pre-hypertension, mean age 41.1 ± 1.7) | Single group, no control | UMO® ≈ 9 mL/day (3 mL × 3) | n = 12 | 6 weeks | Wilcoxon
Shinbo, T. (January 2024). Improvement of blood pressure and stress reduction through ingestion of UMO water-soluble silicon. Visiting Professor, Faculty of Medicine, Tottori University.Jimbo, T., & Okada, K. (2023). Improvement of Blood Pressure When Water-Soluble Silicon Is Ingested.
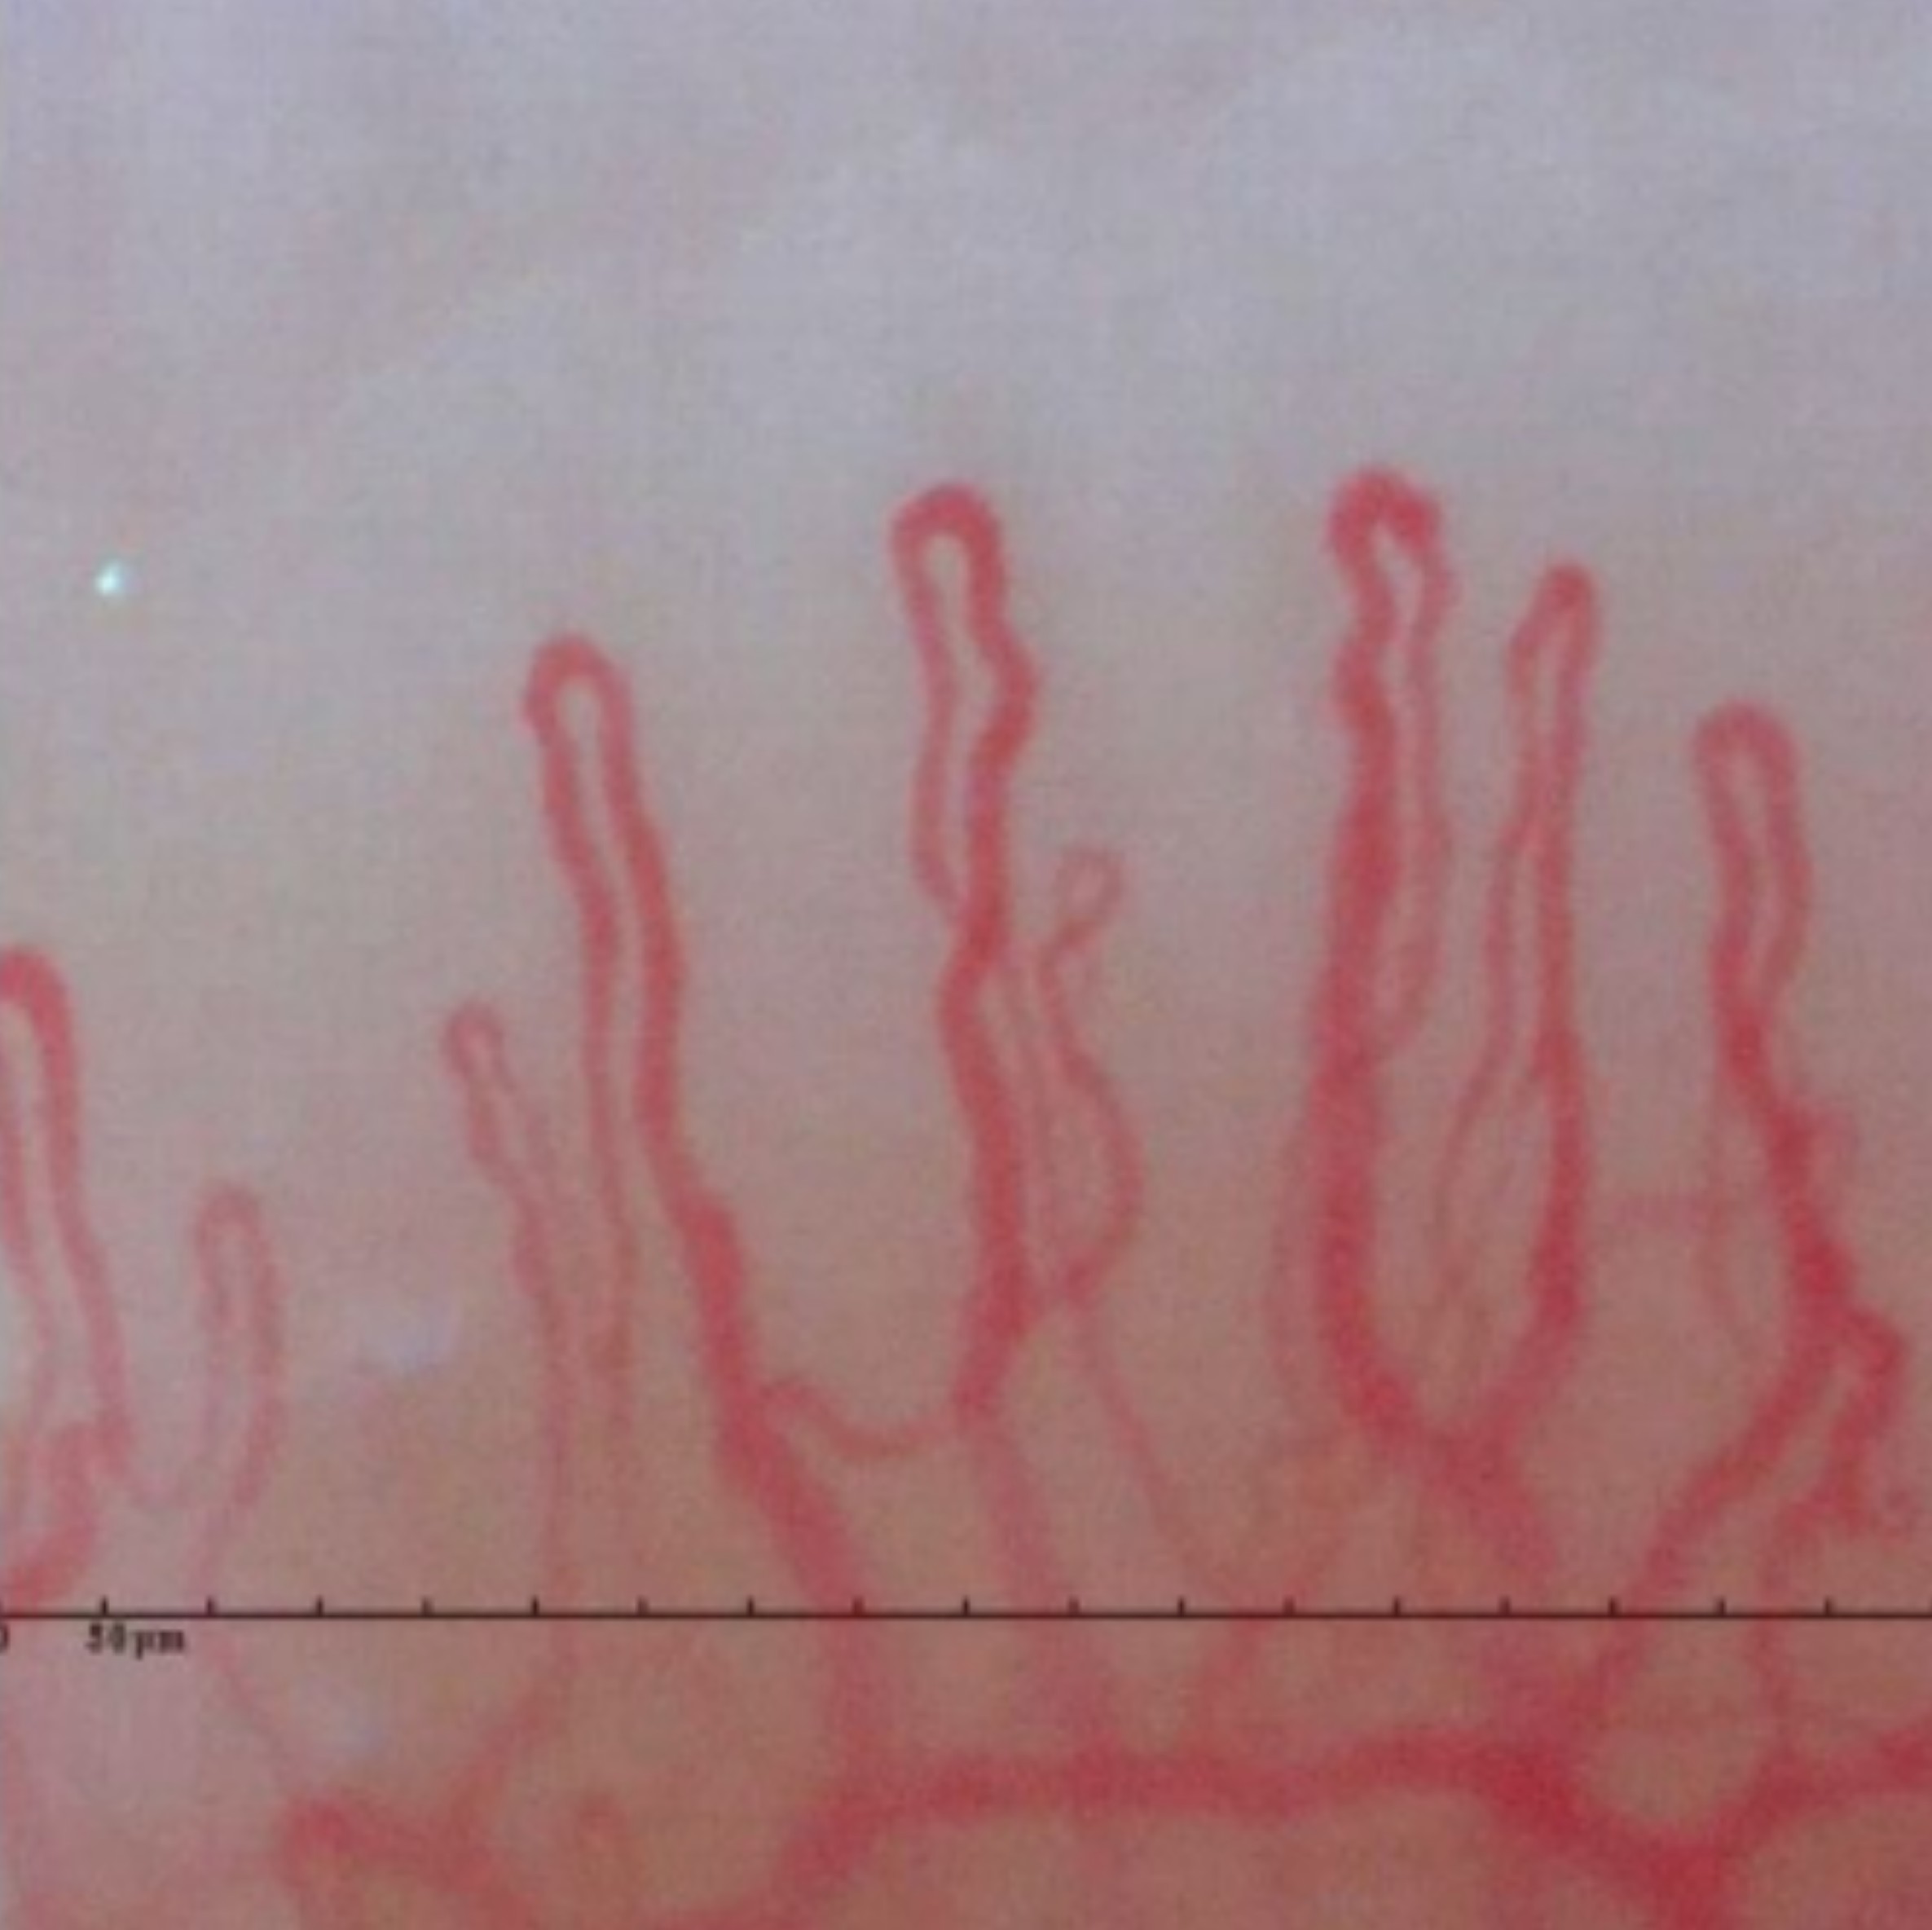
Full paper: Blood Pressure and Stress →Customer Testimonial: Capillary Blood Flow
Human | testimonialSubjectOne customer | n not stated
DoseCrystal UMO® 40 mg
Duration3 months
MethodNailfold capillaroscopy
A customer record, not a controlled test
Tateda, M., Kaneko, S., & Okada, K. (Eds.). (2025). Testimonial Collection: Silicon (Silica) Lighting the Way for Intractable Diseases: Records of Doctors, Patients, and Families.
Source: Testimonial Collection →Silicon and Collagen
Reference | not a UMO testSilicon
↓
Fibroblasts
collagen-making cells
collagen-making cells
↓
Procollagen ↑
↓
Type I & III collagen ↑
Reffitt DM, Ogston N, Jugdaohsingh R, Cheung HF, Evans BA, Thompson RP, Powell JJ, Hampson GN. Orthosilicic acid stimulates collagen type 1 synthesis and osteoblastic differentiation in human osteoblast-like cells in vitro. Bone. 2003 Feb;32(2):127-35.Geesin JC, Darr D, Kaufman R, Murad S, Pinnell SR. Ascorbic acid specifically increases type I and type III procollagen messenger RNA levels in human skin fibroblasts. J Invest Dermatol. 1988 Apr;90(4):420–424. (this paper is about vitamin C)
References | not UMO tests →Framingham Offspring Study
Reference | not a UMO testSubjectsHuman | n = 2,847
IntakeDietary silicon > 40 vs < 14 mg/day
MethodDietary silicon vs bone mineral density
A study on dietary silicon
Jugdaohsingh, R., et al. (2004). Dietary silicon intake is positively associated with bone mineral density in men and premenopausal women of the Framingham Offspring cohort. Journal of Bone and Mineral Research, 19(2), 297–307.
Reference →Silicon: The Cross-Linker of Bone and Skin
Reference | not a UMO testSilicon links collagen chains
↓
Collagen holds calcium in place
↓
Denser, less brittle bone
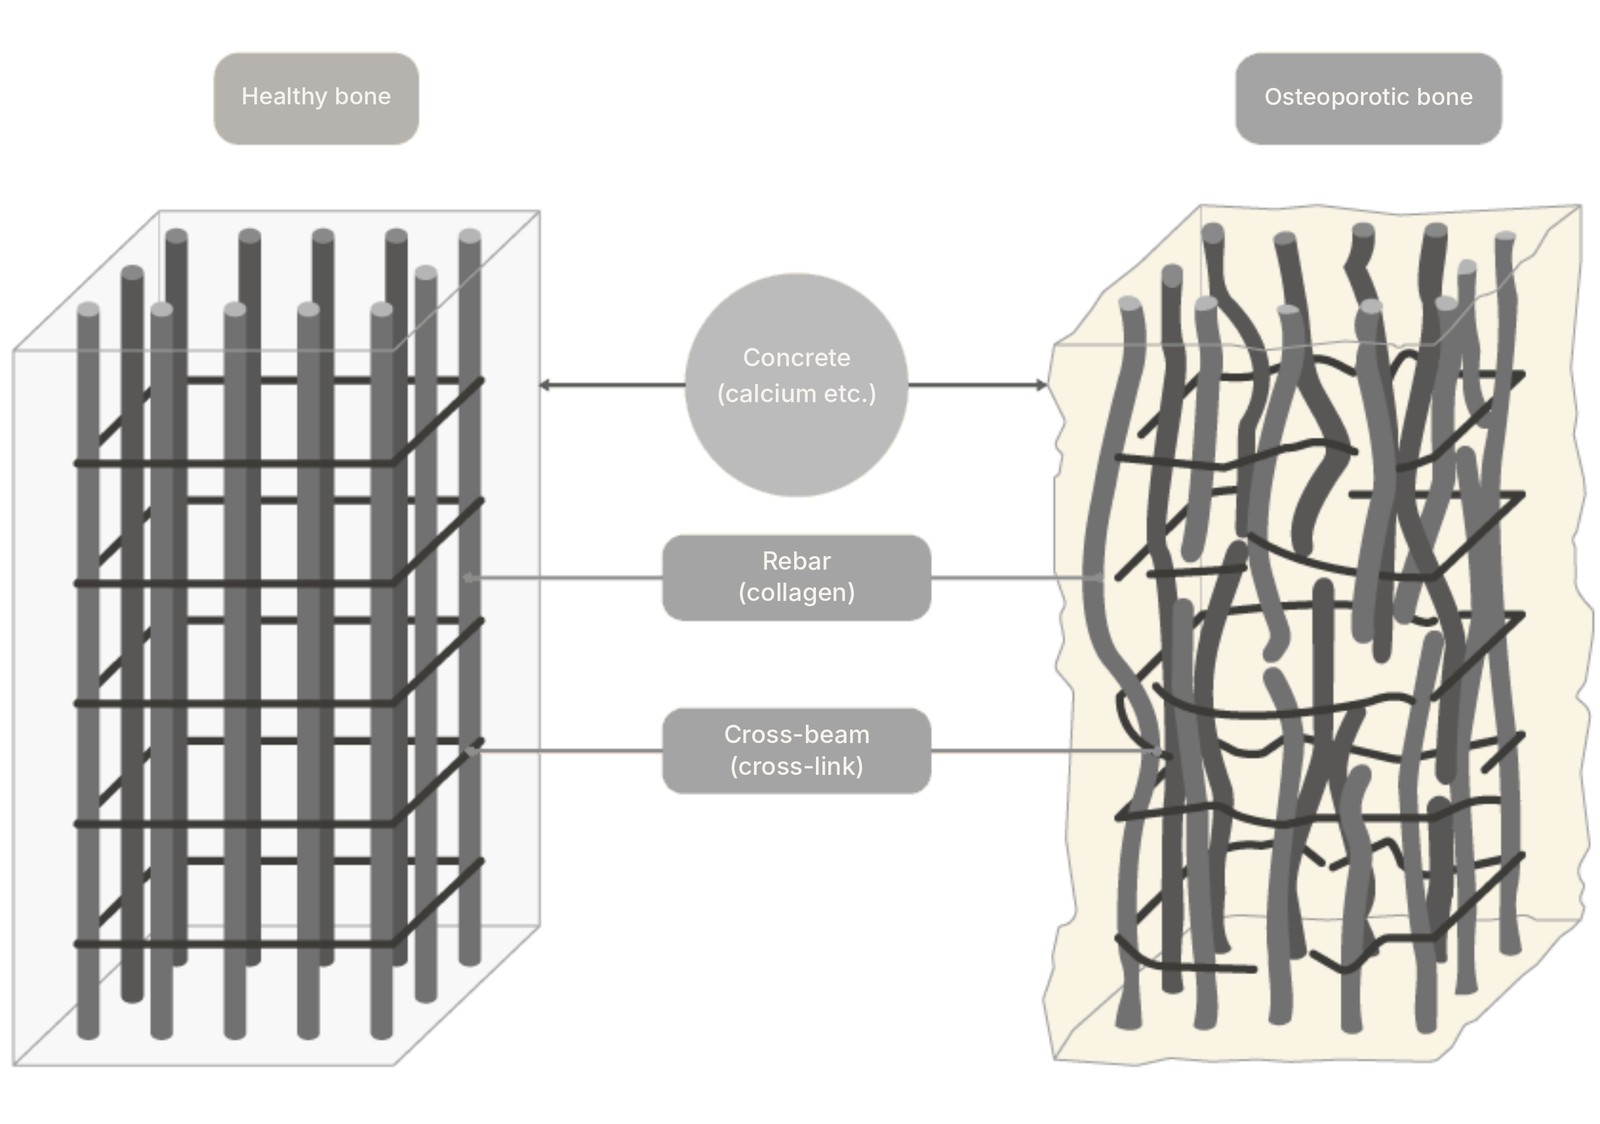
Reffitt et al., 2003. Orthosilicic acid stimulates collagen type I synthesis and osteoblastic differentiation in vitro. Bone.Carlisle, 1986. Silicon as an essential trace element in animal nutrition. Ciba Foundation Symposium.
References | not UMO tests →Rat Bone Strength and Vessel Elasticity
Animal | ratSubjectsWistar rat, male, 10 wk | n = 3–4
GroupsControl (tap water) | UMO® 10%
Rare sugar | UMO® + rare sugar
Rare sugar | UMO® + rare sugar
Dose10% in water
Duration50 days | tensile test
Animal data, not human
Terms
Tensile testA bone or vessel is pulled until it breaks, measuring force and stretch.
Radius, ulna / humerus / femur, tibiaForearm / upper arm / thigh and shin bones.
Rare sugarA sugar found in very small amounts in nature; tested as a separate group.
| vs control (tap water) | UMO® 10% | UMO® + rare sugar (10% each) |
|---|---|---|
| Vessel max strain | ↑ p = 0.0391 | ↑ p = 0.0044 |
| Radius stress | ↑ p = 0.0039 | ↑ p = 0.0095 |
| Ulna + radius stress | n.s. (p = 0.1752) | ↑ p < 10⁻⁴ |
| Humerus stress | ↑ trend (p = 0.0956) | ↑ p = 0.0135 |
| Femur, tibia stress | n.s. | n.s. |
| Radius diameter | ↓ p < 10⁻⁶ | ↓ p = 0.0037 |
n.s. = not significant | trend = p < 0.1
Kawamura, Y., Yokota, Y., Nogata, F., Terasawa, M., Kamijo, T., & Okada, K. (2014, May).Analysis of Stress-Strain of Rat's Bone and Blood Vessel with Dietary Silicon Intake. IEICE Technical Report, MBE2014-7.
Full paper: Rat Bone and Vessel →Immune Function in Rats
Animal | ratSubjectsWistar rat, male, 15 wk
DoseUMO® 1% in water
Duration58 days (n = 4) | 70 days (n = 5)
Source2013 | no significance test
A small animal study
Terms
ThymusIn the chest; trains T cells; shrinks with age.
SpleenUpper left belly; stores lymphocytes and filters blood.
Wistar ratsA common lab rat strain.
| Organ | Group | 58 days | 70 days |
|---|---|---|---|
| Spleen | Water | 2.16M ± 0.45M | 3.48M ± 1.52M |
| UMO® 1% | 2.95M ± 1.31M (↑ 36.6%) | 5.15M ± 1.36M (↑ 48.0%) | |
| Thymus | Water | 6.97M ± 2.70M | 3.36M ± 1.79M |
| UMO® 1% | 13.0M ± 5.45M (↑ 86.5%) | 5.96M ± 2.72M (↑ 77.4%) |
Mean ± s.d. as printed
Terasawa, M., Okada, K., & Sugahara, A. (2013).Effects of water-soluble silicon (umo) on the immune function in rats. Journal of Health and Medical Research, (5). Japan Society of Health and Medical Sciences.
Full paper: Immune Function →Nail Minerals and Heavy Metals: Observation Test (n = 1)
Human | n = 1Subject1 healthy man, 50s | n = 1
DoseUMO® 4 mL/day
2020-03-13 → 2020-12-04
2020-03-13 → 2020-12-04
MethodXRF (Rigaku NEX CG)
Toshiba Nanoanalysis
Toshiba Nanoanalysis
PeriodNails 2020-01 → 2022-11
Terms
X-ray fluorescence (XRF)X-rays make each element give a different signal; many elements at once. Semi-quantitative, so numbers are rough.
Mass ppmWeight concentration; 150 ppm = about 150 mg silicon per kg of nail.
Semi-quantitative analysisShows ups and downs, not calibrated with standards.
n = 1One person, no control; results cannot be applied to people in general.
10 repeat measurementsShows instrument error, not differences between people.
Silicon ↑, Aluminum ↓OligoScan analysis of minerals and heavy metals in the body showed silicon deficiency and aluminum build-up.Silicon and aluminum are generally thought to be inversely related, like selenium and mercury.
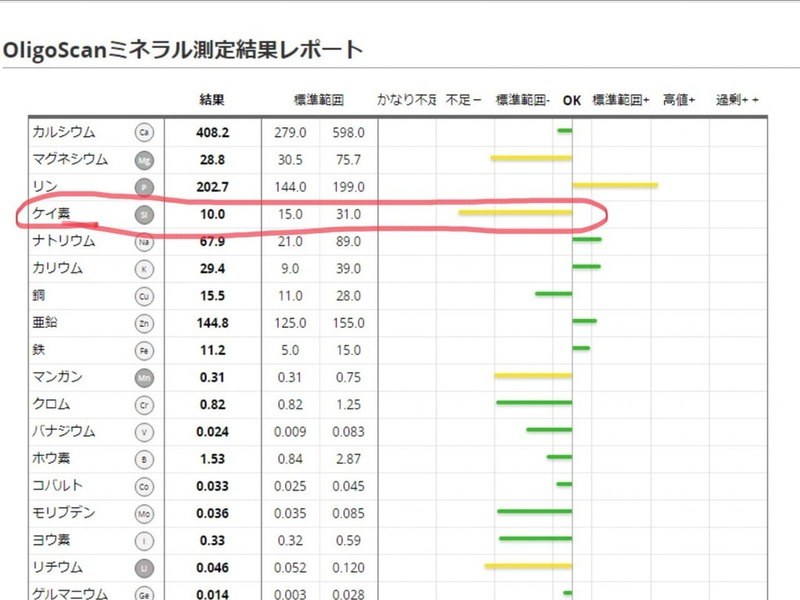
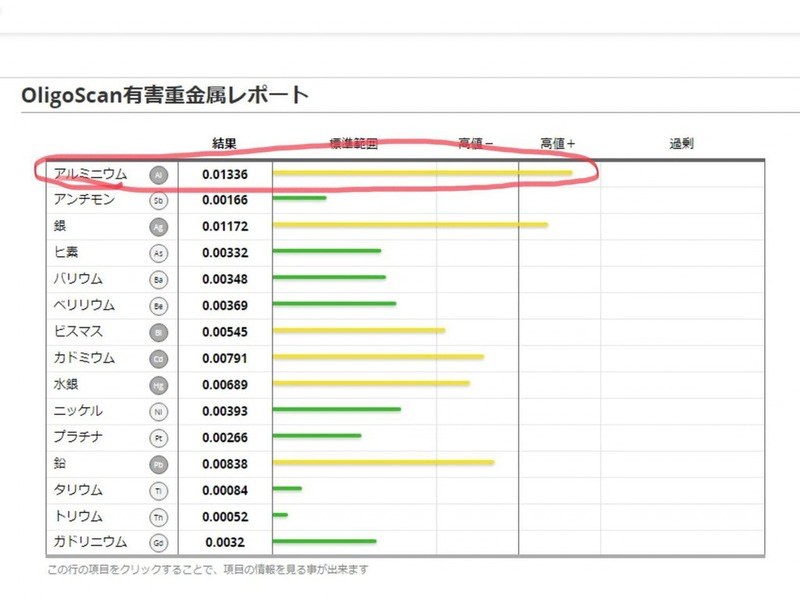
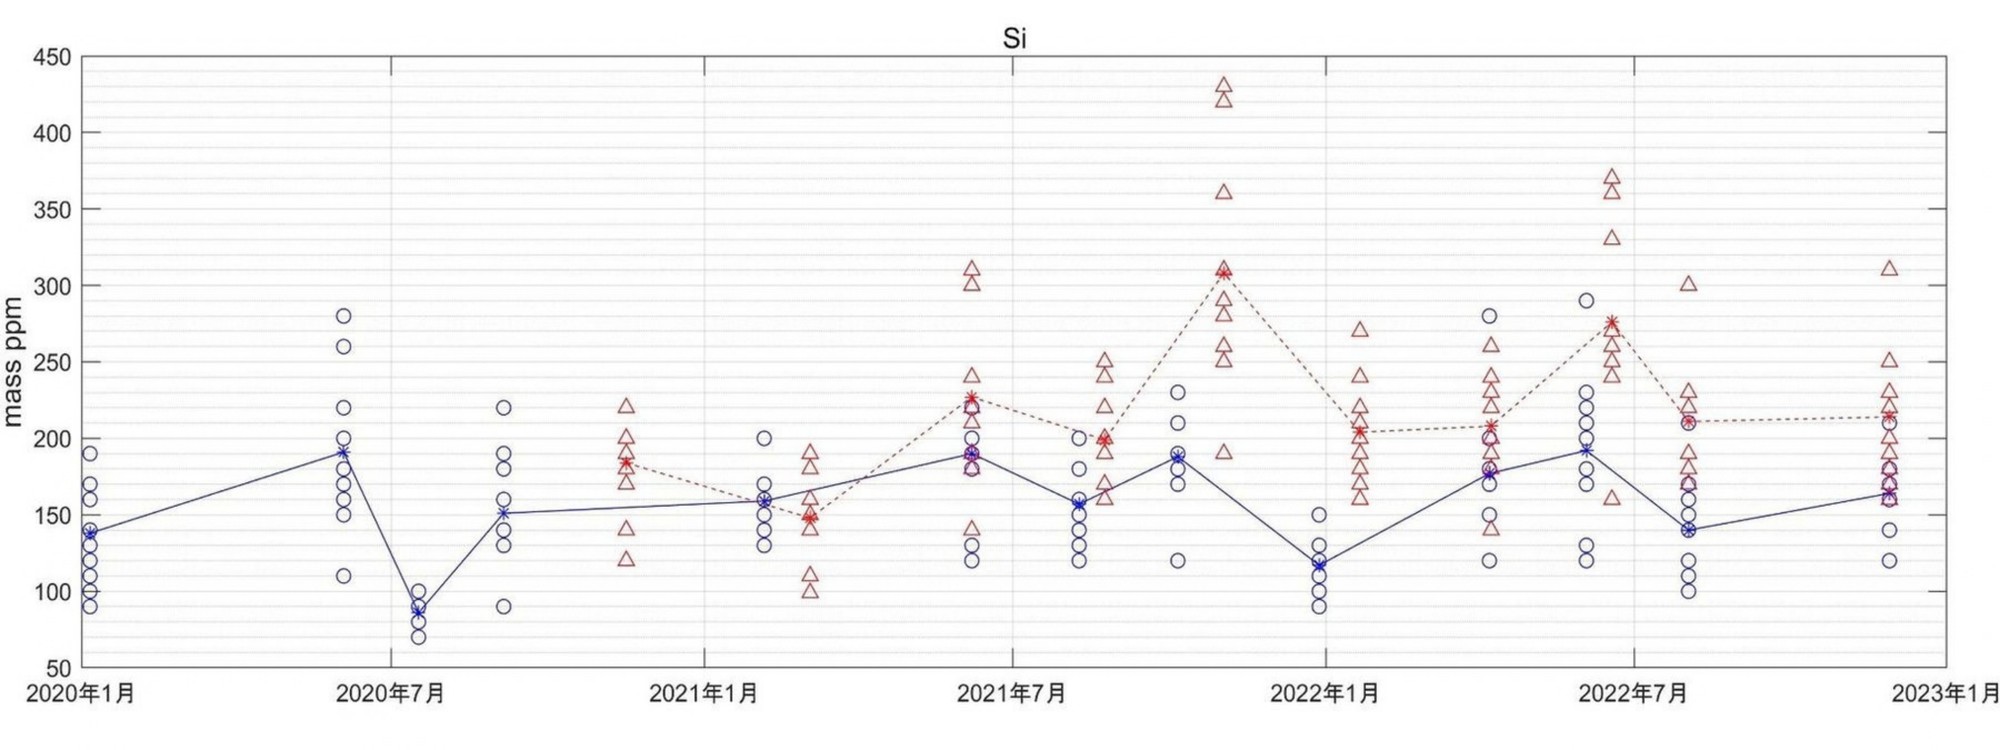
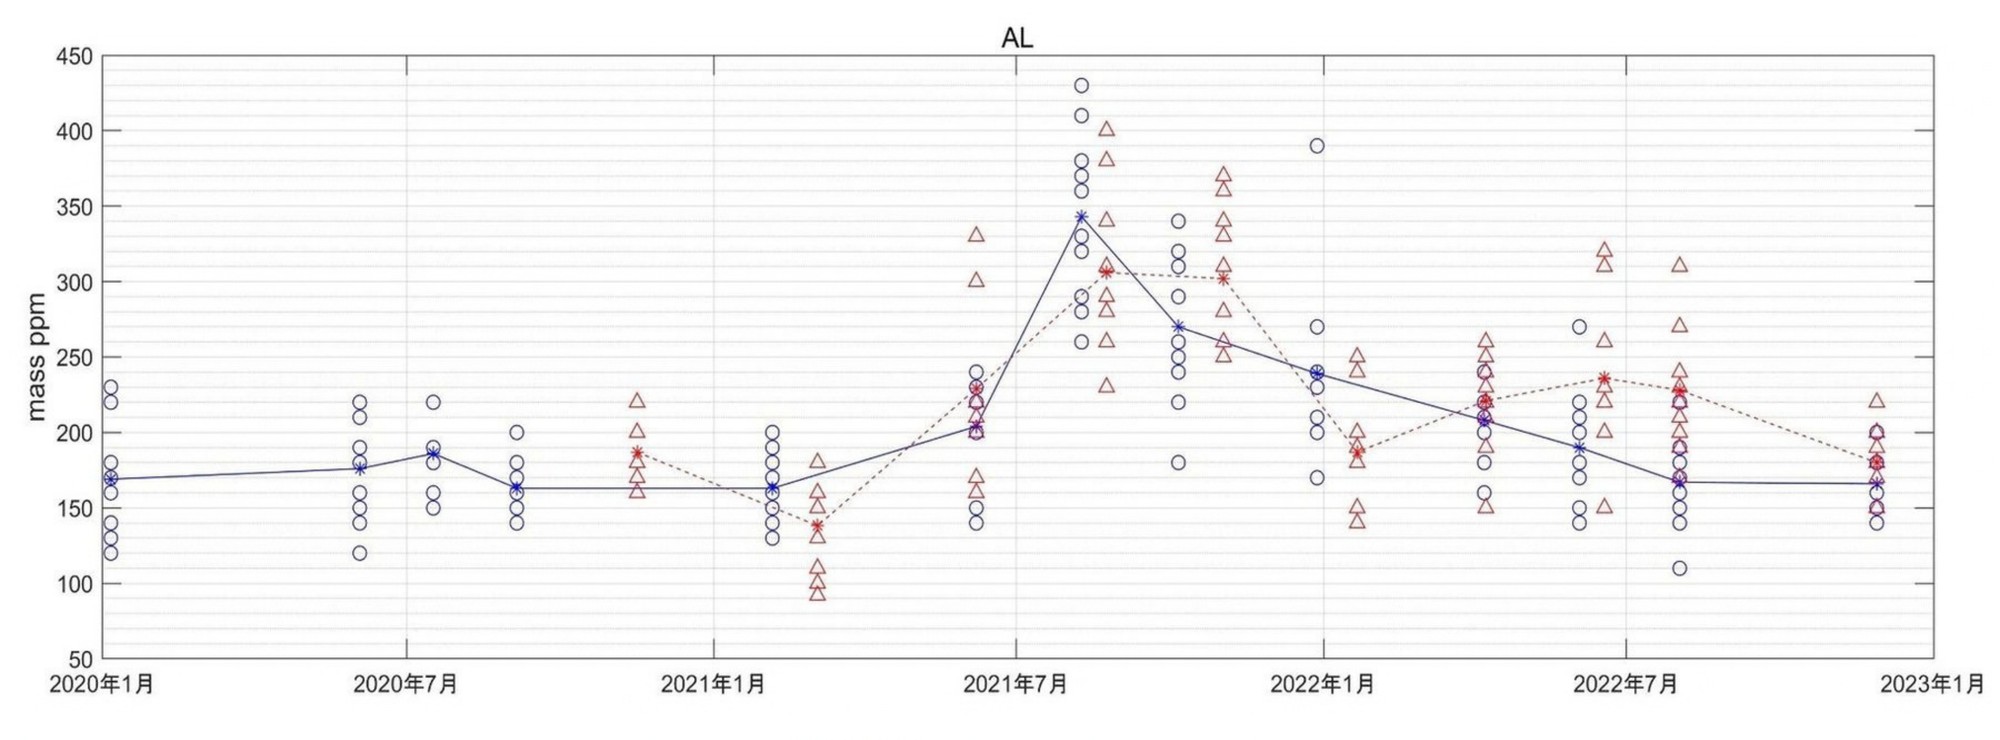
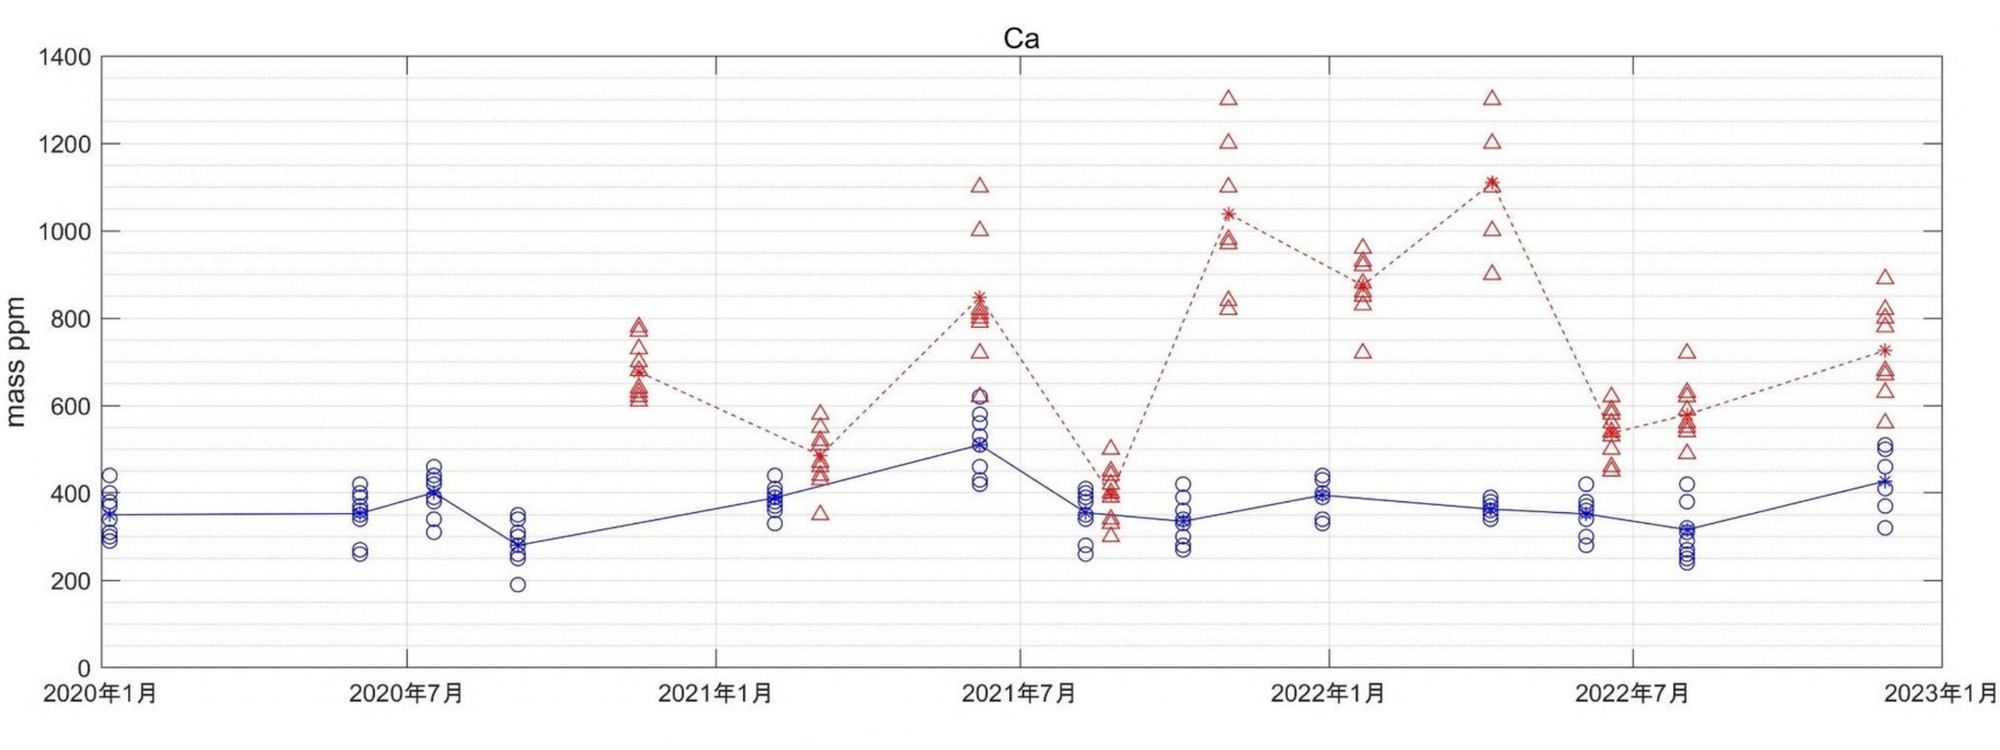

Yokota, Y. (2023, May 14).Changes in Elemental Content of Human Nails With Intake of Water-Soluble Silicon UMO [Conference presentation]. Japan Society of Silicon Medical Research Clinical Meeting. Gifu University, Tokai National Higher Education and Research System.
Full paper: Nail Elements →Kidney Function and Safety
Animal | ratSubjectsWistar rat, male, 7 wk | 13 rats
ModelAdenine-induced kidney damage
DoseUndiluted UMO®, daily oral
Duration28 days | 2021-03-01 → 04-30
SourceTest No. 21775
A small animal study
Terms
Adenine modelToo much adenine forms crystals in the kidneys, causing damage similar to CKD.
Urine creatinineA muscle waste product removed by the kidneys.
NOAELThe highest dose with no side effects.
| Item | Control | UMO® only | Adenine + water | Adenine + UMO® |
|---|---|---|---|---|
| Condition | Normal | Normal | No deaths | No deaths |
| Body weight | Normal gain | Normal gain | No gain after 2 wk | No gain after 2 wk |
| Urine volume | ≈ 1× | ≈ 1× | ≈ 5× | ≈ 4× |
| Urine creatinine | ≈ 1× | ≈ 1× | ≈ 1/6 | ≈ 1/4 |
| Urine phosphorus (wk 4) | — | — | High | High (↓ 23%) |
| γ-GTP / TG / T-CHO / PL | Baseline | ↓ 23% / 32% / 14% / 13% | — | — |
Week 2 vs before | — = not described
APA Corporation. (2021).Renal Function and Safety Evaluation Study Using Adenine-Induced Kidney Damage Model Rats (Test No. 21775). Aitec Laboratory Co., Ltd.
Full paper: Kidney Function and Safety →Antioxidant: Free Radical Scavenging
In vitroMarkerFree radical scavenging
DoseUMO® 10× | 100× | 1000×
Superoxide ↓ + Hydroxyl radical ↓
↓
Oxidative damage ↓
↓
Oxidative aging ↓
Terms
Free radicalsUnstable molecules from metabolism and UV that damage cells and speed up ageing.
ESRDetects free-radical signals directly. Scavenging rate ↑ higher is better.
| ROS | Share in body | 10× | 100× | 1000× |
|---|---|---|---|---|
| Superoxide (O₂⁻) | ≈ 70–80% | 85.0% | 65.5% | 12.5% |
| Hydroxyl (·OH) | ≈ 5–10% | 67.2% | 13.8% | −3.9% (no effect) |
| Singlet oxygen (¹O₂) | ≈ 1–3% | 17.2% | 1.9% (weak) | – |
↑ better | – = not in deck
Taiichi Maeda, Chang-Il Lee, & Fumihiko Yoshino. (January 2014).Measurement of the Scavenging Ability of Water-Soluble Silicon "UMO®" Against Various Reactive Oxygen Species Using the Electron Spin Resonance (ESR) Method.Kanagawa Dental University Graduate School.
Full paper: Free Radical Scavenging →Gut Health: Broiler Fecal Odor
Animal | broilerSubjectsBroiler | n = 30
DoseUMO® 1% | 5% in water
Duration7 weeks (chart: "After 50 days")
2017-04
2017-04
Animal data, not human
Yamamoto, J., et al. (2017).Beneficial effect of water-soluble silicon on the meat quality and fecal odor of broiler chickens. J. Vet. Med. (Tokyo), 70(4), 279–282.
Full paper: Broiler Manure Odor →Pet: Bad Breath in Dogs
Pet | beagle dogsSubjects5 beagle dogs | male & female
DoseUMO® 1% | 5% in water
Duration4 weeks (wk 2 & 4)
SourceAzabu University | APA Corporation (2018)
A small study | 5 dogs
| Score | Pre | 2 w 1% | 2 w 5% | 4 w 1% | 4 w 5% | Reported |
|---|---|---|---|---|---|---|
| Halitosis | 5.0 / 5.0 | ≈ 4.8 | ≈ 3.0 | ≈ 4.6 | ≈ 3.2 | ↓ 8% (1%), ↓ 36% (5%) |
| Bacteria | ≈ 3.8 / ≈ 3.8 | ≈ 3.1 | ≈ 2.3 | ≈ 3.1 | ≈ 0.8 * | ↓ 18% (1%), ↓ 79% (5%) |
≈ = read from chart | * sig. at 4 w (5%)

Azabu University and APA Corporation (2018).Study on the effect of water-soluble silicon on reducing bad breath in dogs. Azabu University Joint Research Report No. 2584, pp. 1–10.
Full paper: Dog Bad Breath →Fecal Odor in Mice
Animal | mouseSubjectsC57BL/6 male mice | n = 11–12
DietHigh-fat, 60% kcal lard
DoseUMO® 1% | 10% in water
Si 83.7 | 837 µg/mL
Si 83.7 | 837 µg/mL
Duration7 weeks
Animal data, not human
Terms
High-fat diet60% of calories from lard, to mimic obesity and fatty liver.
Note | Both UMO® groups drank less water (authors: silicon’s bitter taste)
Sugita, K., Kawai, A., Shirai, M., Takagi, Y., Goto, S., & Asai, F. (2015).Effect of Water-soluble Silicon on Liver Damage and Fecal Odor in High-fat Diet-fed Mice. Journal of Veterinary Medicine (Juui Chikusan Shinpo), 68(11), 843–847.
Full paper: Fecal Odor in Mice →Safety Checks
Test Reports & Certification
Made from natural quartz, but after the patented process it is no longer crystalline.
XRD test✓
No cristobaliteNot found ✓XRD test✓
No tridymiteNot found ✓GLP study✓
NegativeNo cell toxicity, no gene mutation ✓PFAS test✓
Not detectedPFOS, PFOA, PFHxS, PFNA ✓·X-ray diffraction (XRD) identifies crystal structure. UMO is 100% non-crystalline silicon.
·The safety study under Good Laboratory Practice (GLP) found no genotoxic risk, in both the screening test and the main study.
·Four PFAS compounds (PFOS, PFOA, PFHxS, PFNA) were not detected in the UMO concentrated solution raw material. Limit of quantification: 20 ng/kg.
Test reports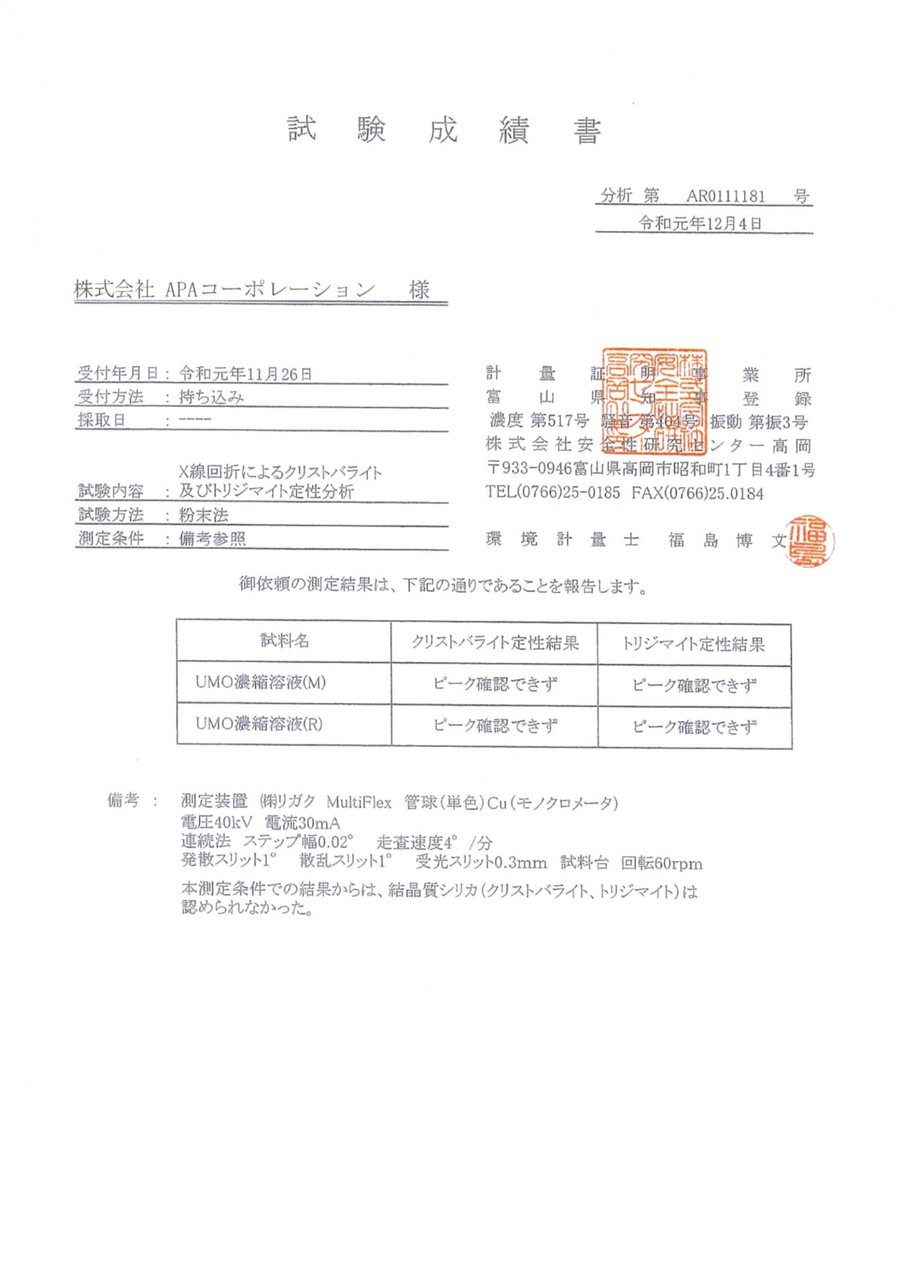 XRD testNon-crystalline silicon
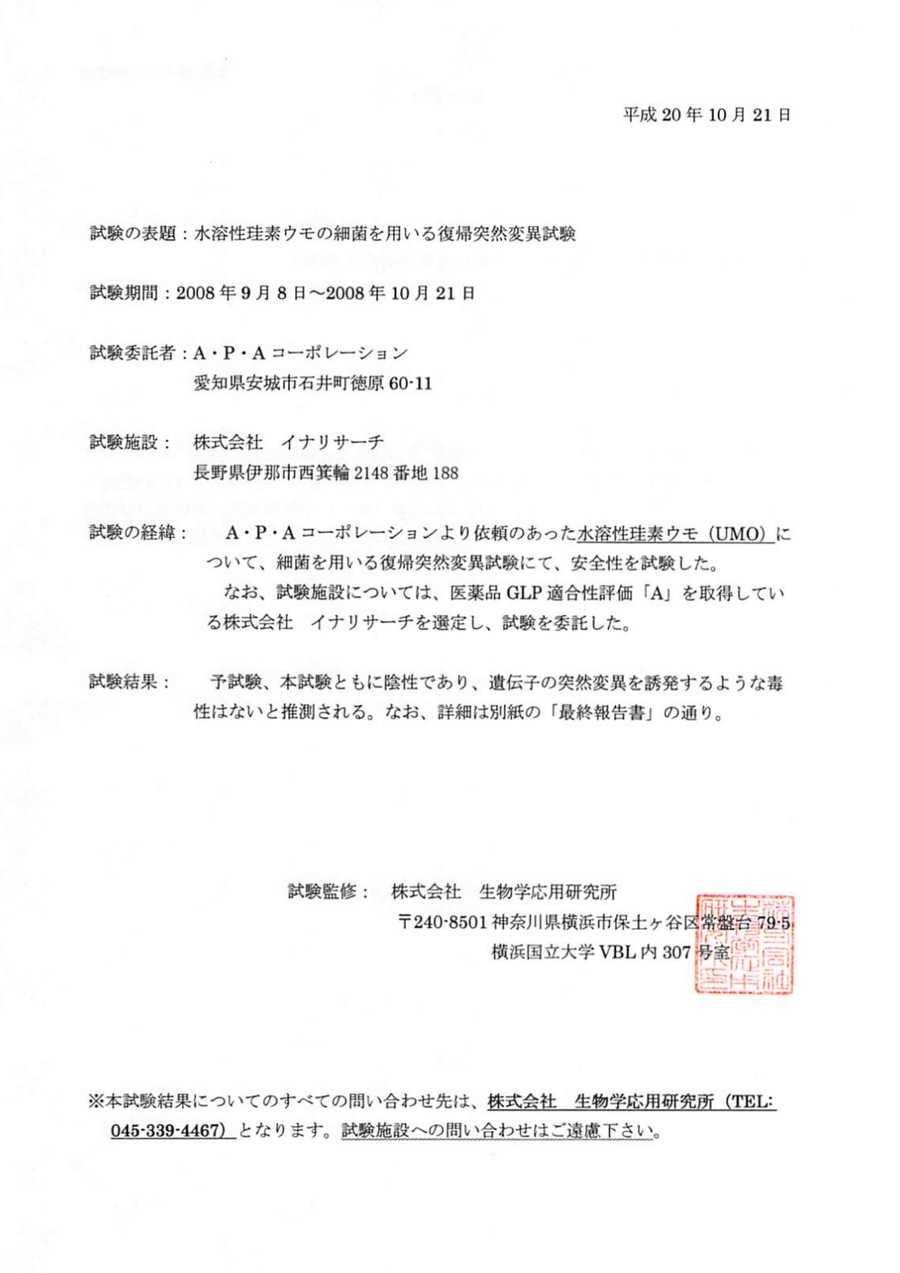 GLP studyNo genotoxic risk
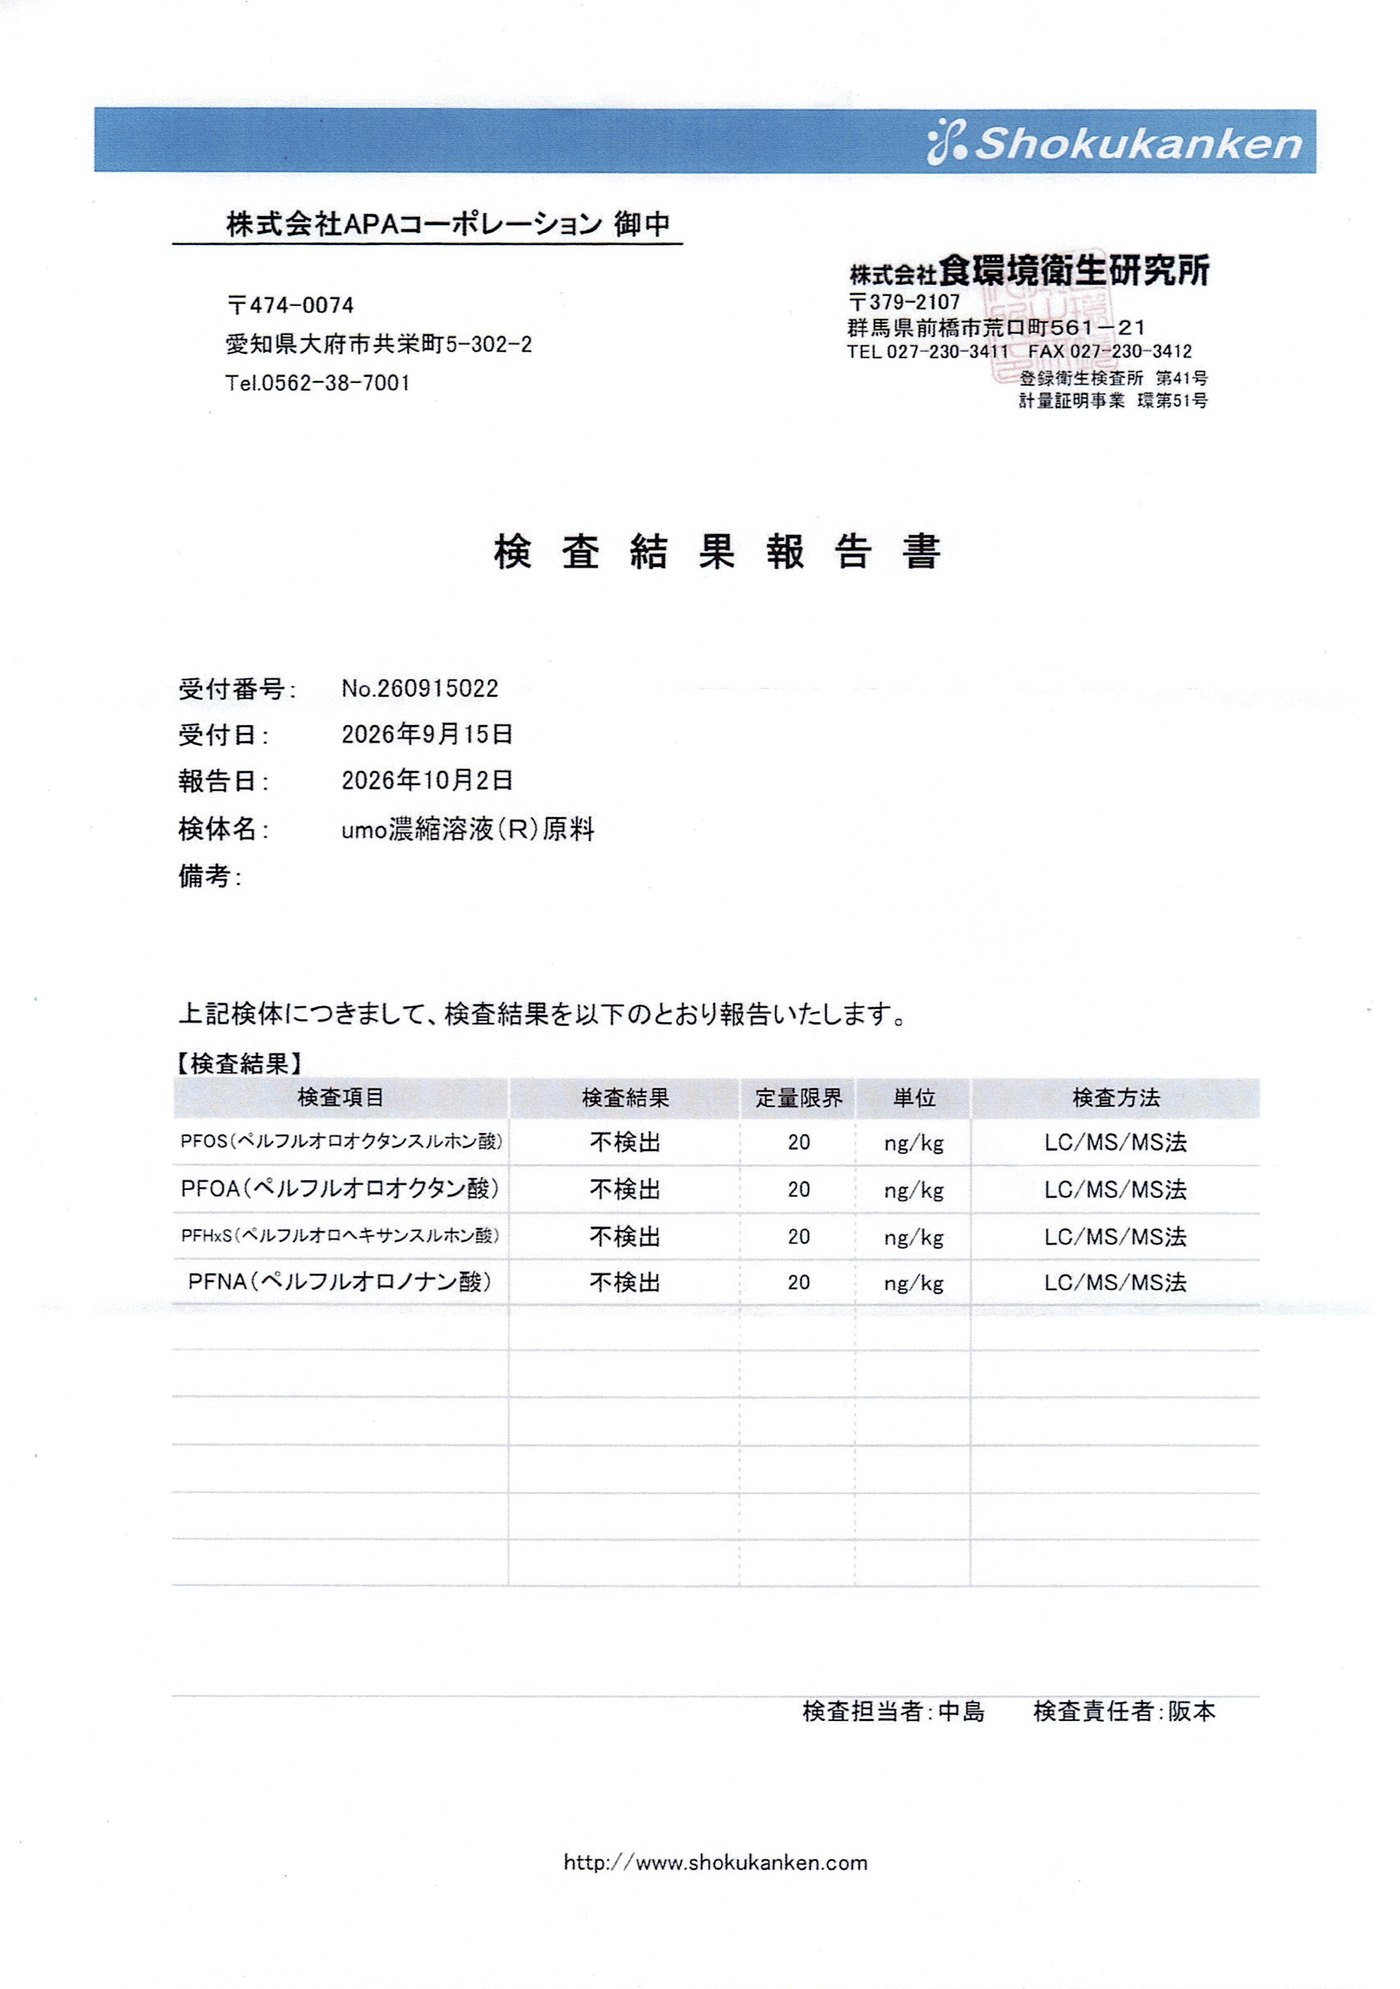 2 Oct 2026PFAS test (Shokukanken)
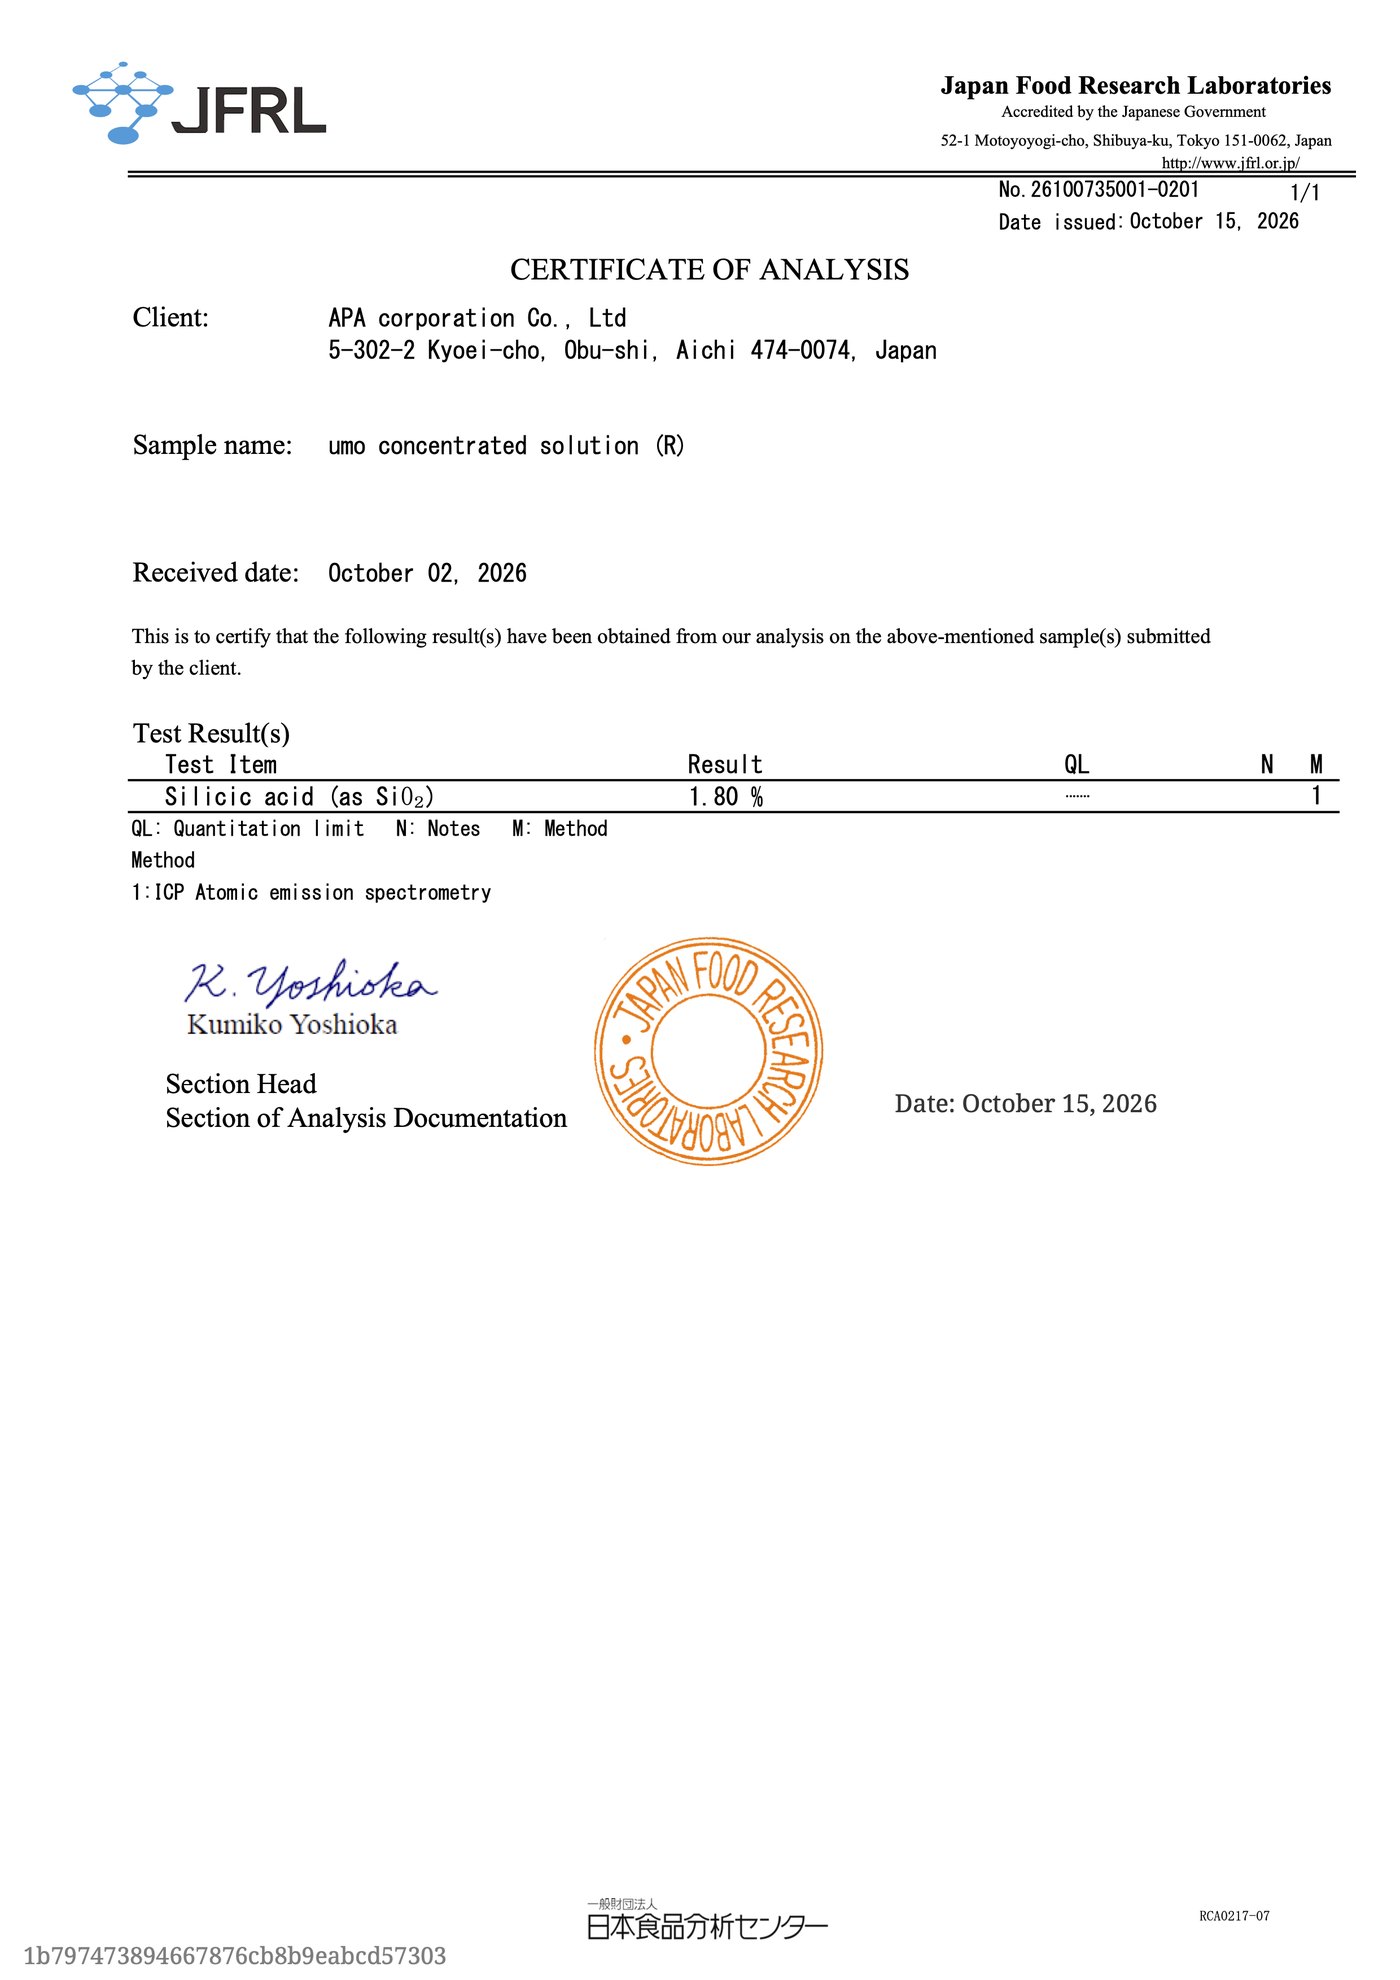 15 Oct 2026Silicic acid 1.80% (JFRL)
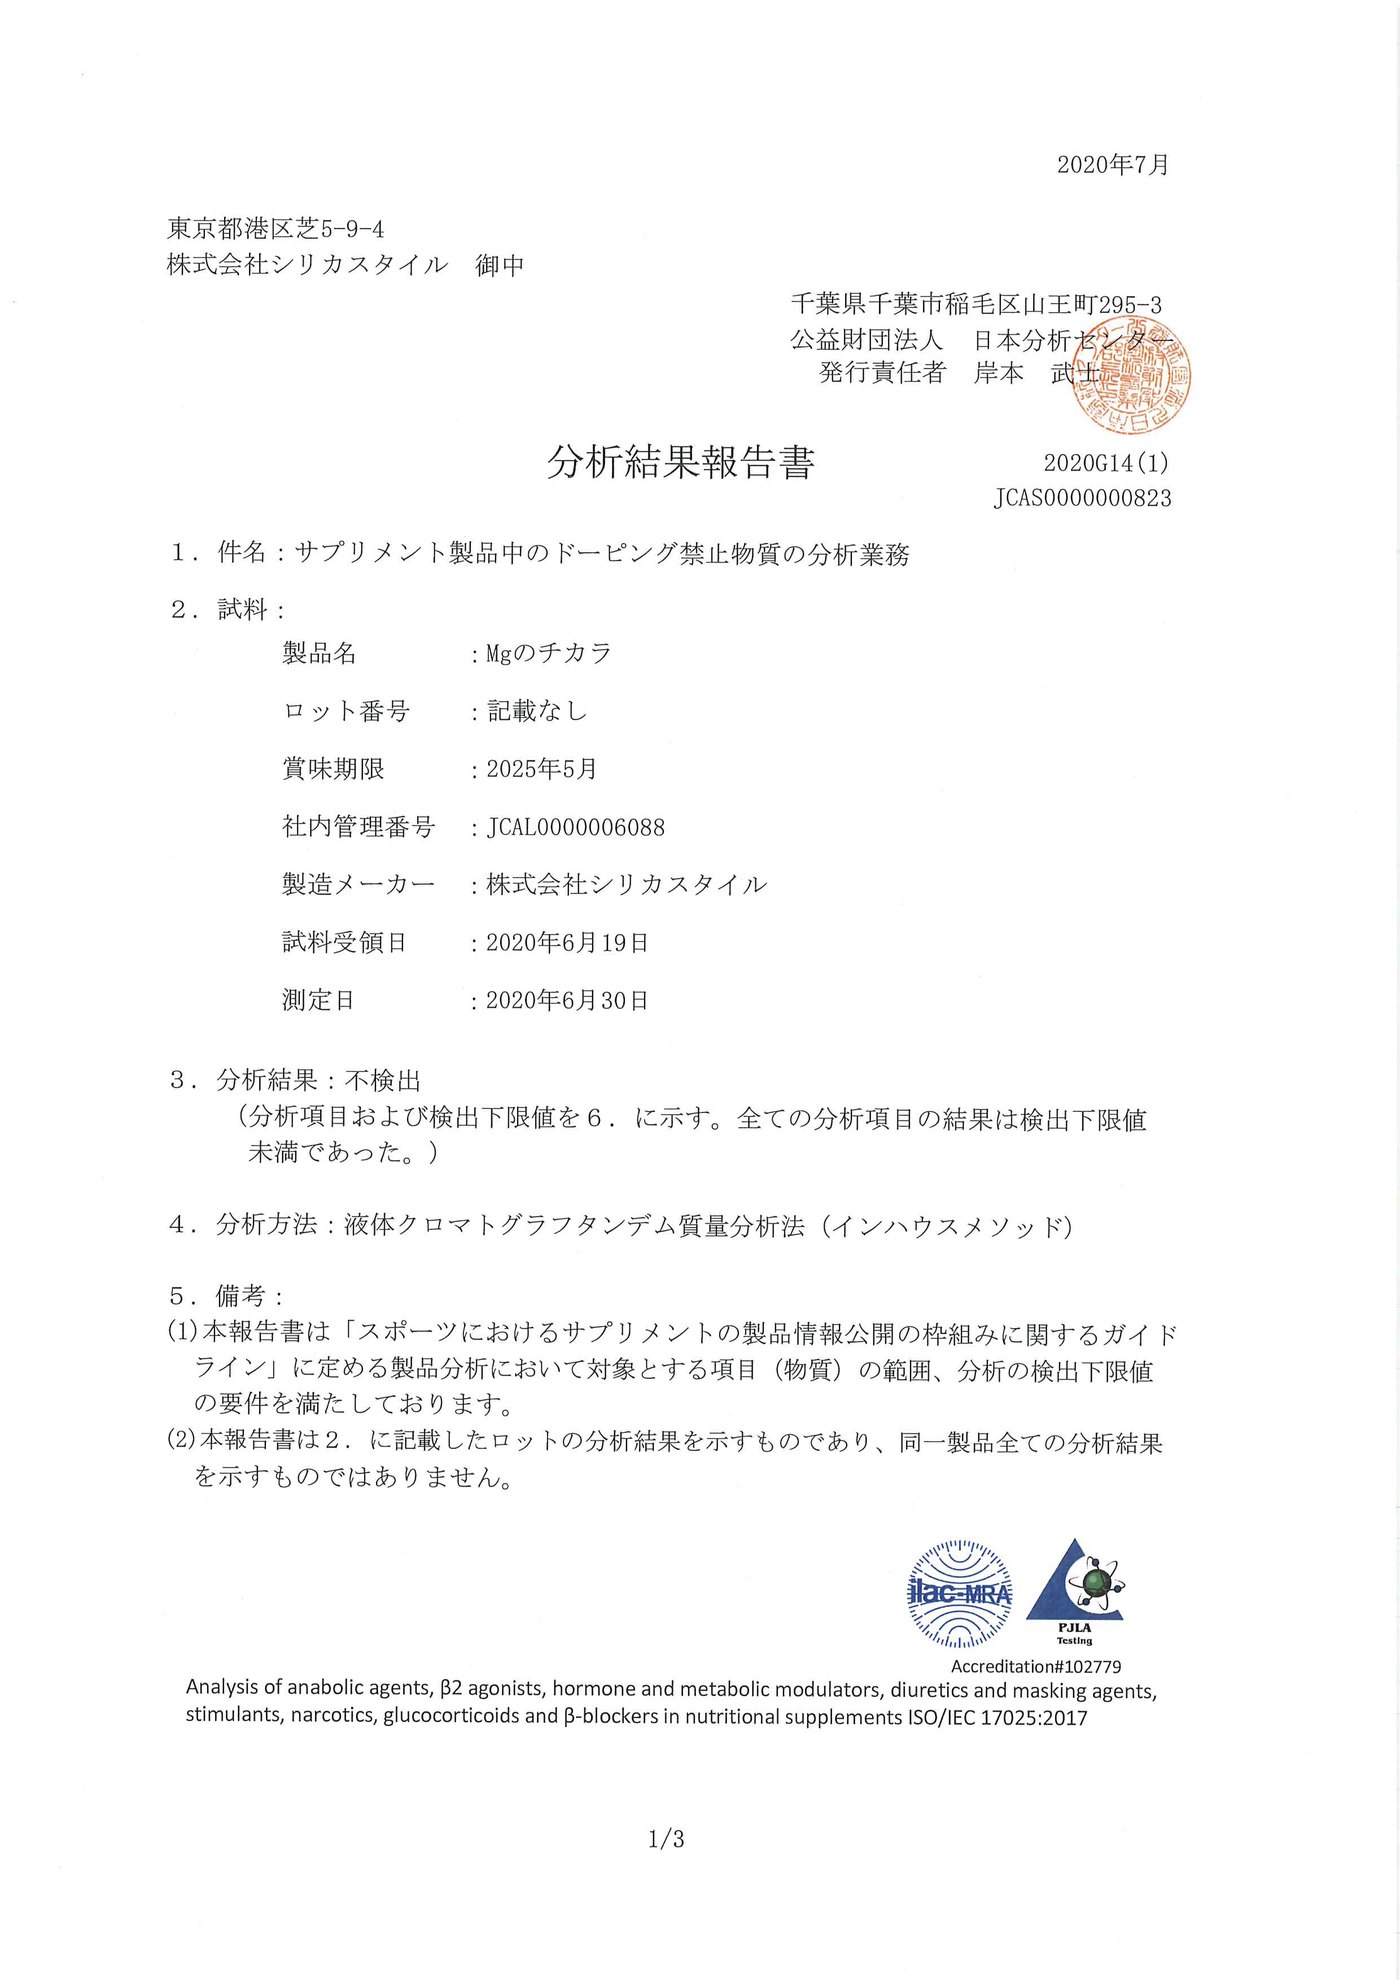 Anti-dopingNo active substance
XRD testNon-crystalline siliconGLP studyNo genotoxic risk2 Oct 2026PFAS test (Shokukanken)15 Oct 2026Silicic acid 1.80% (JFRL)Anti-dopingNo active substanceCertificates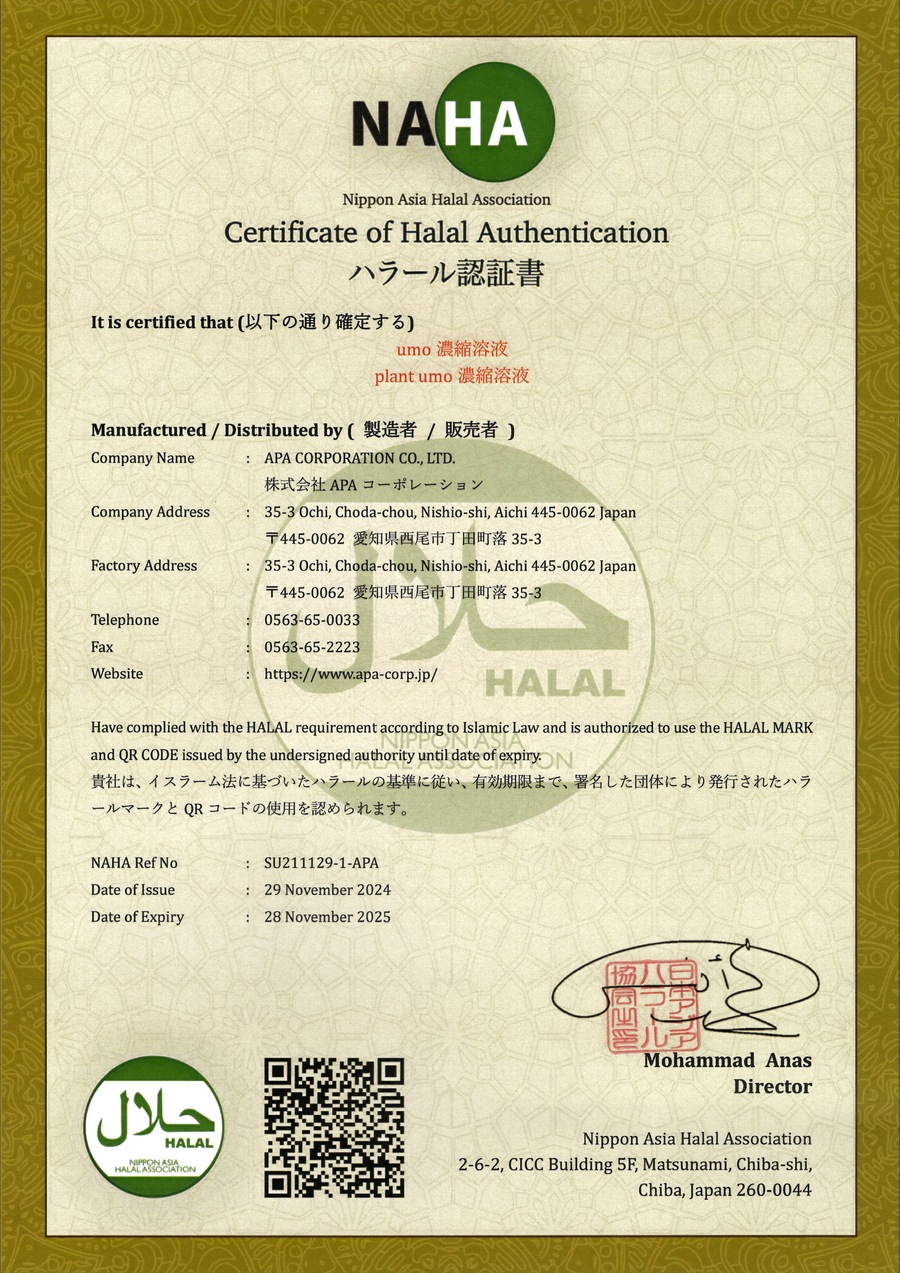 Halal (NAHA)
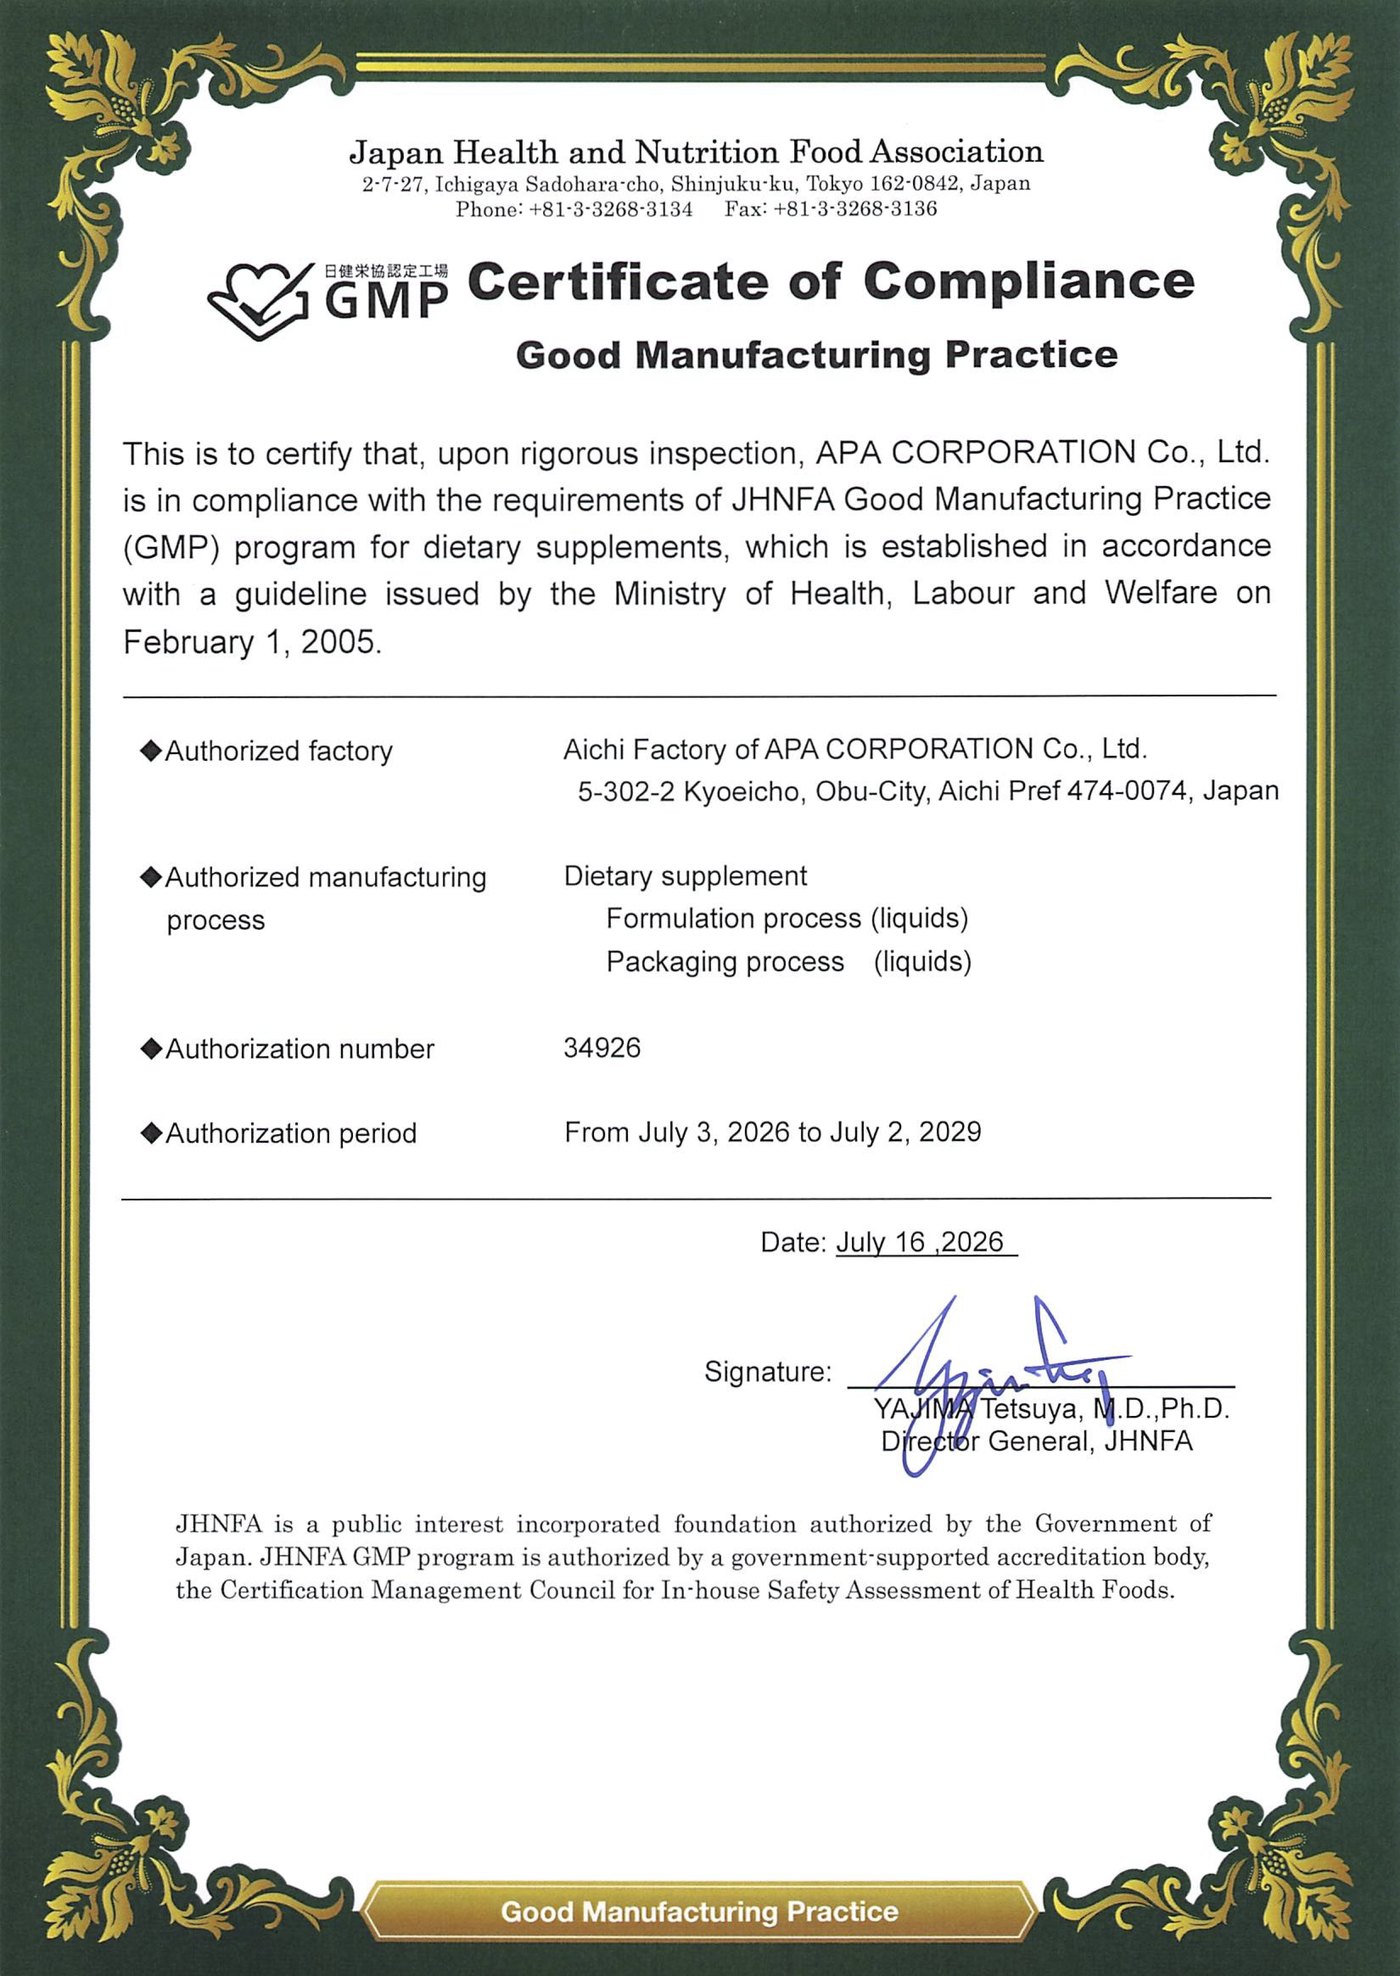 Valid to 2 Jul 2029JHNFA GMP, dietary supplements
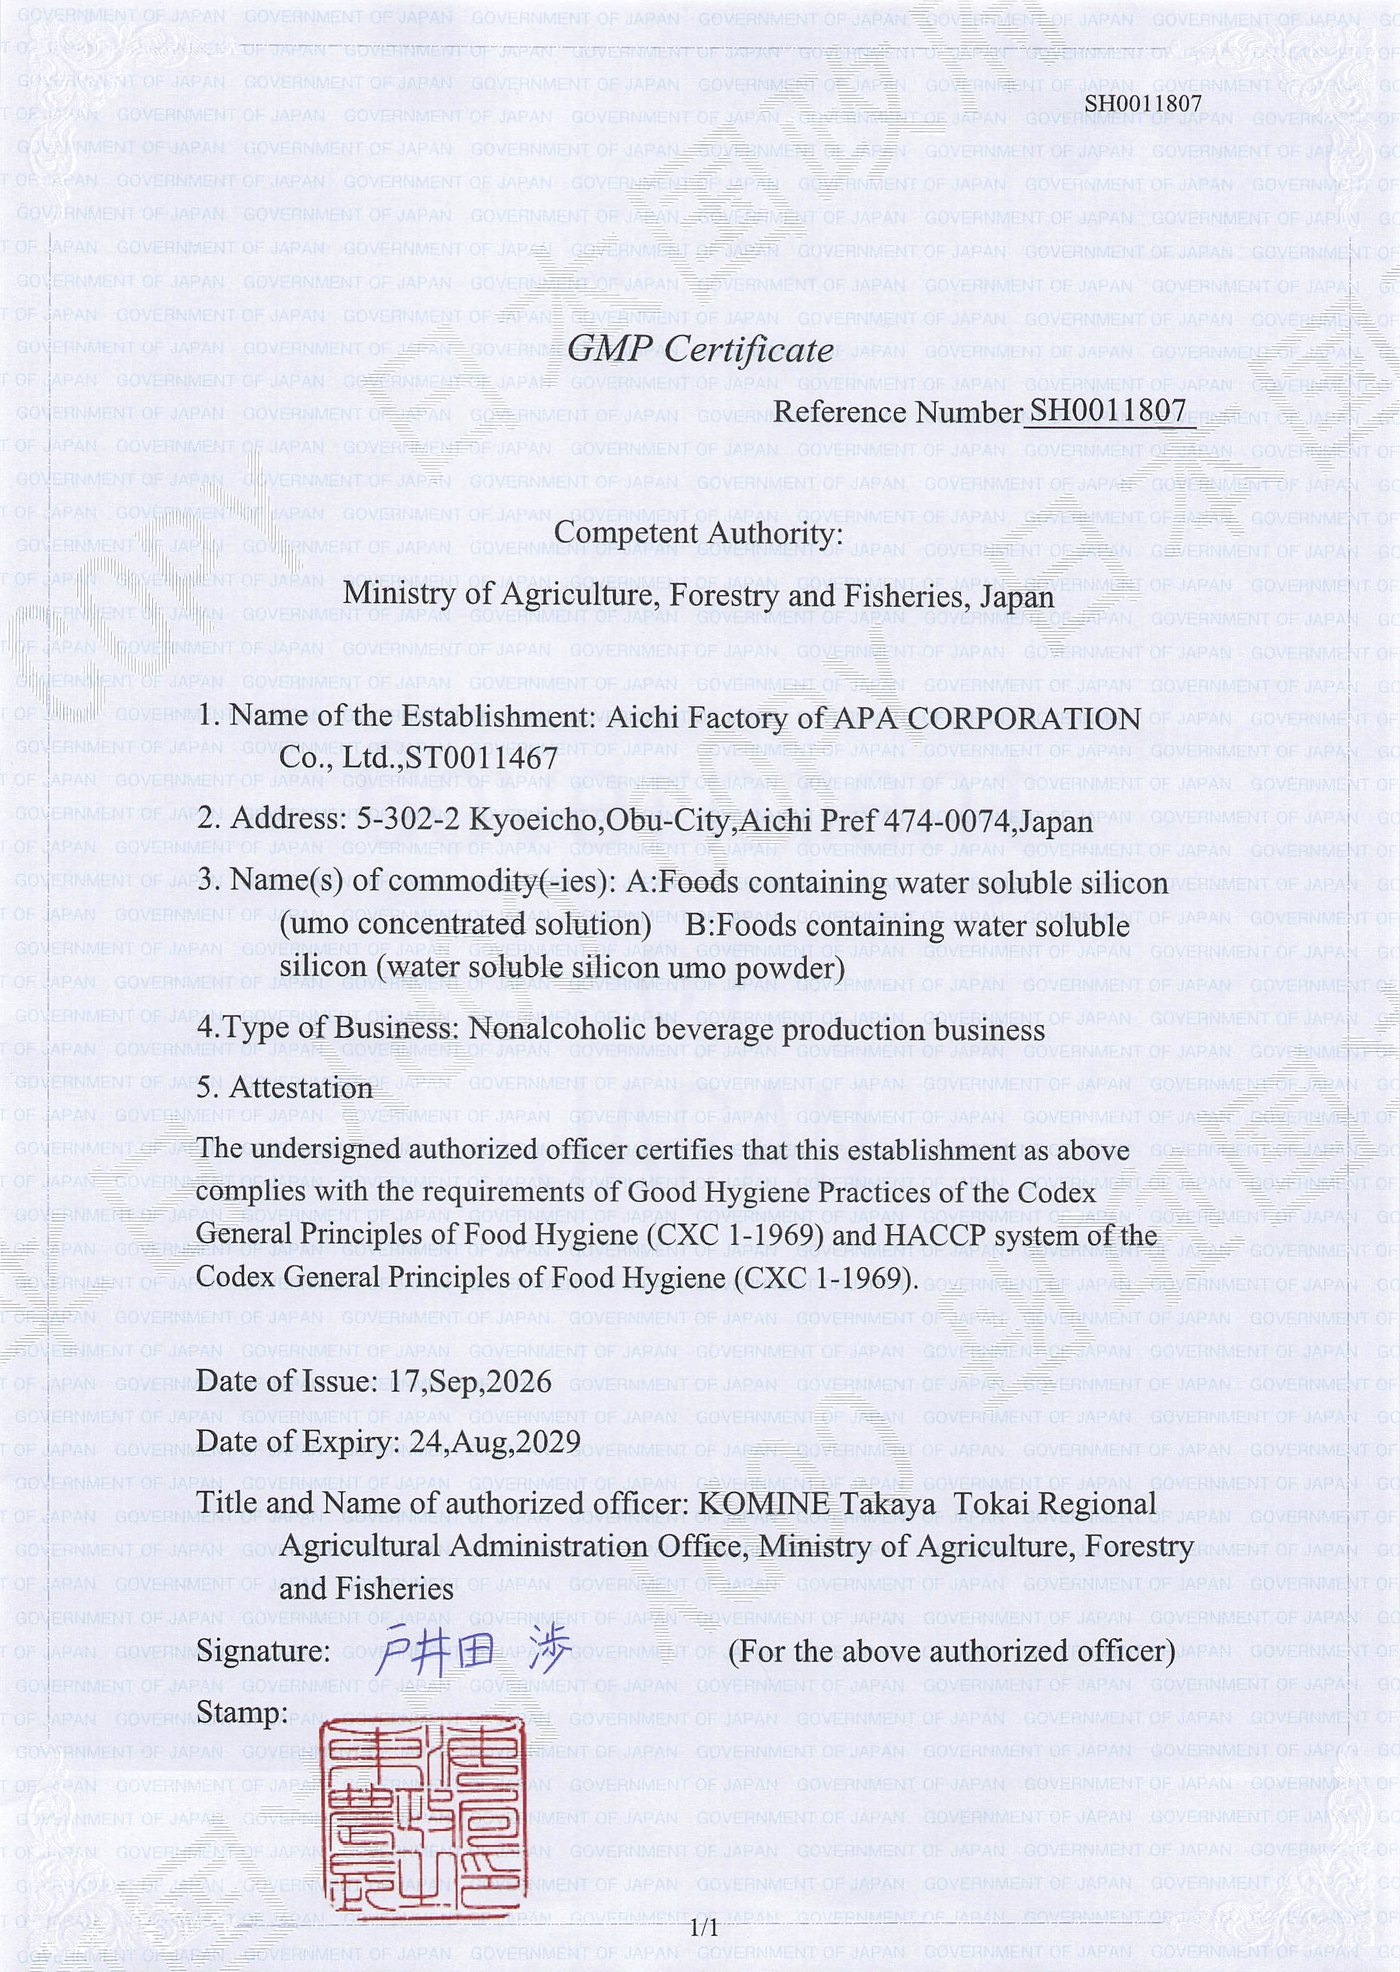 Valid to 24 Aug 2029MAFF GHP and HACCP
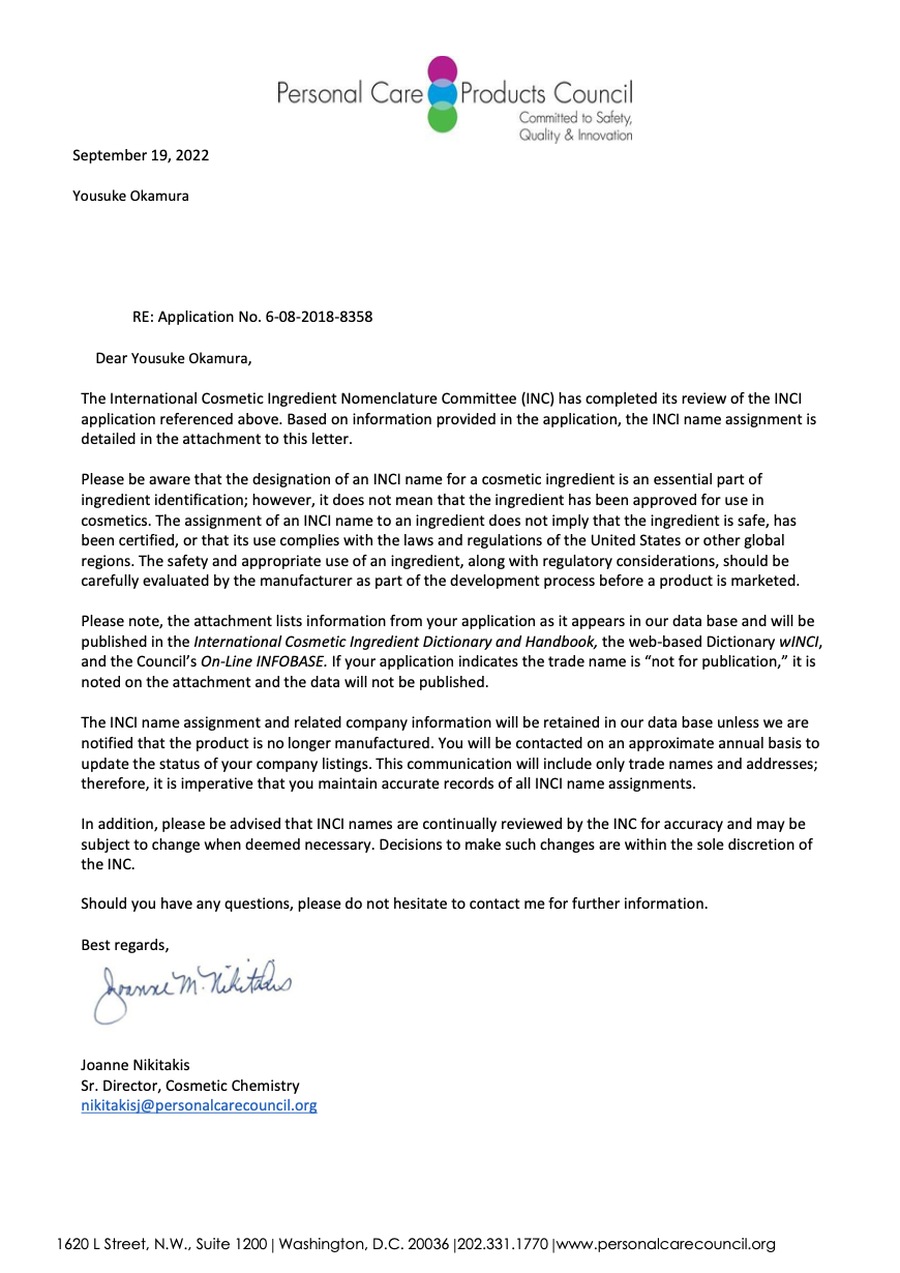 19 Sep 2022INCI name registration (PCPC)
Halal (NAHA)Valid to 2 Jul 2029JHNFA GMP, dietary supplementsValid to 24 Aug 2029MAFF GHP and HACCP19 Sep 2022INCI name registration (PCPC)·Halal certified by the Nippon Asia Halal Association. Indonesia’s BPJPH recognises NAHA certificates, with the same legal effect for cross-border clearance and sales.
·Made at APA Corporation’s Aichi factory, certified under JHNFA GMP and by Japan’s Ministry of Agriculture, Forestry and Fisheries (MAFF) for hygiene and HACCP.
·The INCI letter registers the name Hydrated Silica. It is not a safety approval.
Bring UMO® to Your Product
Tell us what you make.
We reply with the right documents and samples.
Tell us what you need.
I would like toThis page presents research on the ingredient only.It does not make any claim about a finished product.Results come from the stated test conditions and may not apply to other products or individuals.KIWITA SDN. BHD. is not responsible for how the ingredient is used in any finished product or for any claims made about it.Terms & DisclaimerThe summaries on this page are prepared by KIWITA SDN. BHD. from third-party test reports and published studies. They are for reference only and are not medical, regulatory or professional advice.KIWITA has made reasonable efforts to summarise them accurately. KIWITA does not guarantee that the summaries, figures or translations are complete, current or free from error. If there is any difference, the original report prevails.Test results apply only to the stated samples and conditions. They are not a guarantee of performance, safety, efficacy or fitness for any product, market or use.You are responsible for checking the original reports and for meeting the laws and regulations of your market, including claims, labelling and registration.To the fullest extent permitted by law, KIWITA SDN. BHD. is not liable for any loss or damage arising from reliance on this page. Samples, specifications, quotations and prices are subject to a separate written agreement.